Yuman vs Immigrants from Philippines Ambulatory Disability
COMPARE
Yuman
Immigrants from Philippines
Ambulatory Disability
Ambulatory Disability Comparison
Yuman
Immigrants from Philippines
7.9%
AMBULATORY DISABILITY
0.0/ 100
METRIC RATING
334th/ 347
METRIC RANK
6.0%
AMBULATORY DISABILITY
83.0/ 100
METRIC RATING
142nd/ 347
METRIC RANK
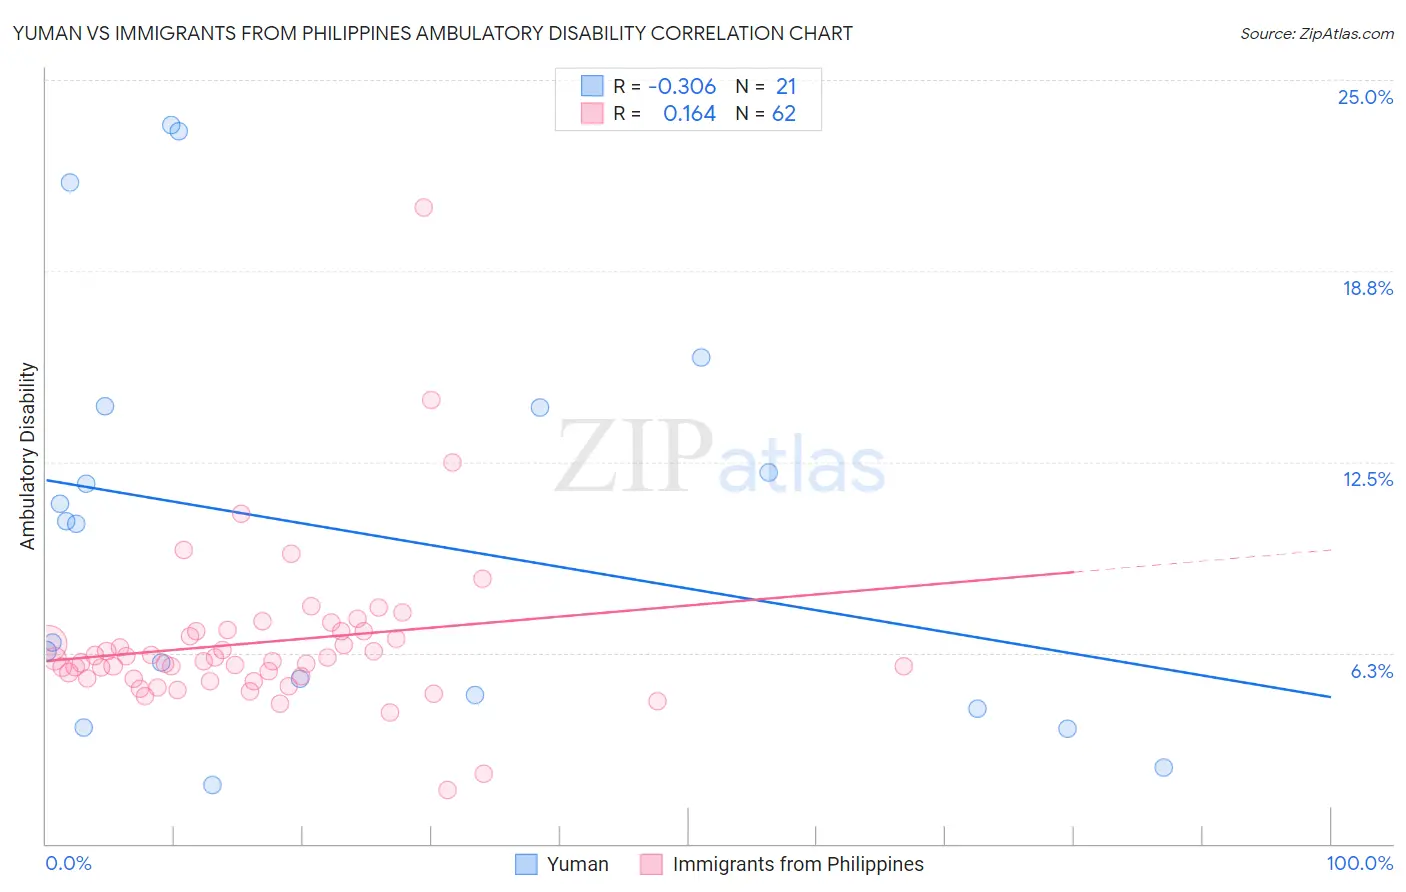
Yuman vs Immigrants from Philippines Ambulatory Disability Correlation Chart
The statistical analysis conducted on geographies consisting of 40,645,433 people shows a mild negative correlation between the proportion of Yuman and percentage of population with ambulatory disability in the United States with a correlation coefficient (R) of -0.306 and weighted average of 7.9%. Similarly, the statistical analysis conducted on geographies consisting of 471,065,462 people shows a poor positive correlation between the proportion of Immigrants from Philippines and percentage of population with ambulatory disability in the United States with a correlation coefficient (R) of 0.164 and weighted average of 6.0%, a difference of 32.7%.
Ambulatory Disability Correlation Summary
| Measurement | Yuman | Immigrants from Philippines |
| Minimum | 1.9% | 1.8% |
| Maximum | 23.5% | 20.8% |
| Range | 21.6% | 19.1% |
| Mean | 10.2% | 6.6% |
| Median | 10.5% | 6.0% |
| Interquartile 25% (IQ1) | 4.6% | 5.4% |
| Interquartile 75% (IQ3) | 14.3% | 7.0% |
| Interquartile Range (IQR) | 9.7% | 1.5% |
| Standard Deviation (Sample) | 6.7% | 2.7% |
| Standard Deviation (Population) | 6.5% | 2.7% |
Similar Demographics by Ambulatory Disability
Demographics Similar to Yuman by Ambulatory Disability
In terms of ambulatory disability, the demographic groups most similar to Yuman are Cherokee (7.9%, a difference of 0.94%), Chickasaw (8.0%, a difference of 1.1%), Seminole (8.0%, a difference of 1.2%), Menominee (7.8%, a difference of 1.8%), and Cajun (7.8%, a difference of 2.1%).
| Demographics | Rating | Rank | Ambulatory Disability |
| Natives/Alaskans | 0.0 /100 | #327 | Tragic 7.5% |
| Hopi | 0.0 /100 | #328 | Tragic 7.6% |
| Pueblo | 0.0 /100 | #329 | Tragic 7.6% |
| Paiute | 0.0 /100 | #330 | Tragic 7.7% |
| Cajuns | 0.0 /100 | #331 | Tragic 7.8% |
| Menominee | 0.0 /100 | #332 | Tragic 7.8% |
| Cherokee | 0.0 /100 | #333 | Tragic 7.9% |
| Yuman | 0.0 /100 | #334 | Tragic 7.9% |
| Chickasaw | 0.0 /100 | #335 | Tragic 8.0% |
| Seminole | 0.0 /100 | #336 | Tragic 8.0% |
| Dutch West Indians | 0.0 /100 | #337 | Tragic 8.2% |
| Colville | 0.0 /100 | #338 | Tragic 8.2% |
| Pima | 0.0 /100 | #339 | Tragic 8.2% |
| Choctaw | 0.0 /100 | #340 | Tragic 8.3% |
| Creek | 0.0 /100 | #341 | Tragic 8.5% |
Demographics Similar to Immigrants from Philippines by Ambulatory Disability
In terms of ambulatory disability, the demographic groups most similar to Immigrants from Philippines are Swedish (6.0%, a difference of 0.010%), Romanian (6.0%, a difference of 0.010%), Macedonian (6.0%, a difference of 0.020%), Czech (6.0%, a difference of 0.030%), and Pakistani (6.0%, a difference of 0.050%).
| Demographics | Rating | Rank | Ambulatory Disability |
| Immigrants | Italy | 85.0 /100 | #135 | Excellent 6.0% |
| Immigrants | North Macedonia | 84.1 /100 | #136 | Excellent 6.0% |
| Immigrants | Syria | 84.1 /100 | #137 | Excellent 6.0% |
| Immigrants | Hungary | 83.9 /100 | #138 | Excellent 6.0% |
| Immigrants | Zaire | 83.6 /100 | #139 | Excellent 6.0% |
| Czechs | 83.3 /100 | #140 | Excellent 6.0% |
| Swedes | 83.1 /100 | #141 | Excellent 6.0% |
| Immigrants | Philippines | 83.0 /100 | #142 | Excellent 6.0% |
| Romanians | 82.9 /100 | #143 | Excellent 6.0% |
| Macedonians | 82.8 /100 | #144 | Excellent 6.0% |
| Pakistanis | 82.5 /100 | #145 | Excellent 6.0% |
| Immigrants | Greece | 82.5 /100 | #146 | Excellent 6.0% |
| Immigrants | Moldova | 82.4 /100 | #147 | Excellent 6.0% |
| Immigrants | Eastern Europe | 82.0 /100 | #148 | Excellent 6.0% |
| Lithuanians | 81.9 /100 | #149 | Excellent 6.0% |