New Zealander vs Arab Single Male Poverty
COMPARE
New Zealander
Arab
Single Male Poverty
Single Male Poverty Comparison
New Zealanders
Arabs
13.2%
SINGLE MALE POVERTY
10.7/ 100
METRIC RATING
221st/ 347
METRIC RANK
13.0%
SINGLE MALE POVERTY
27.0/ 100
METRIC RATING
190th/ 347
METRIC RANK
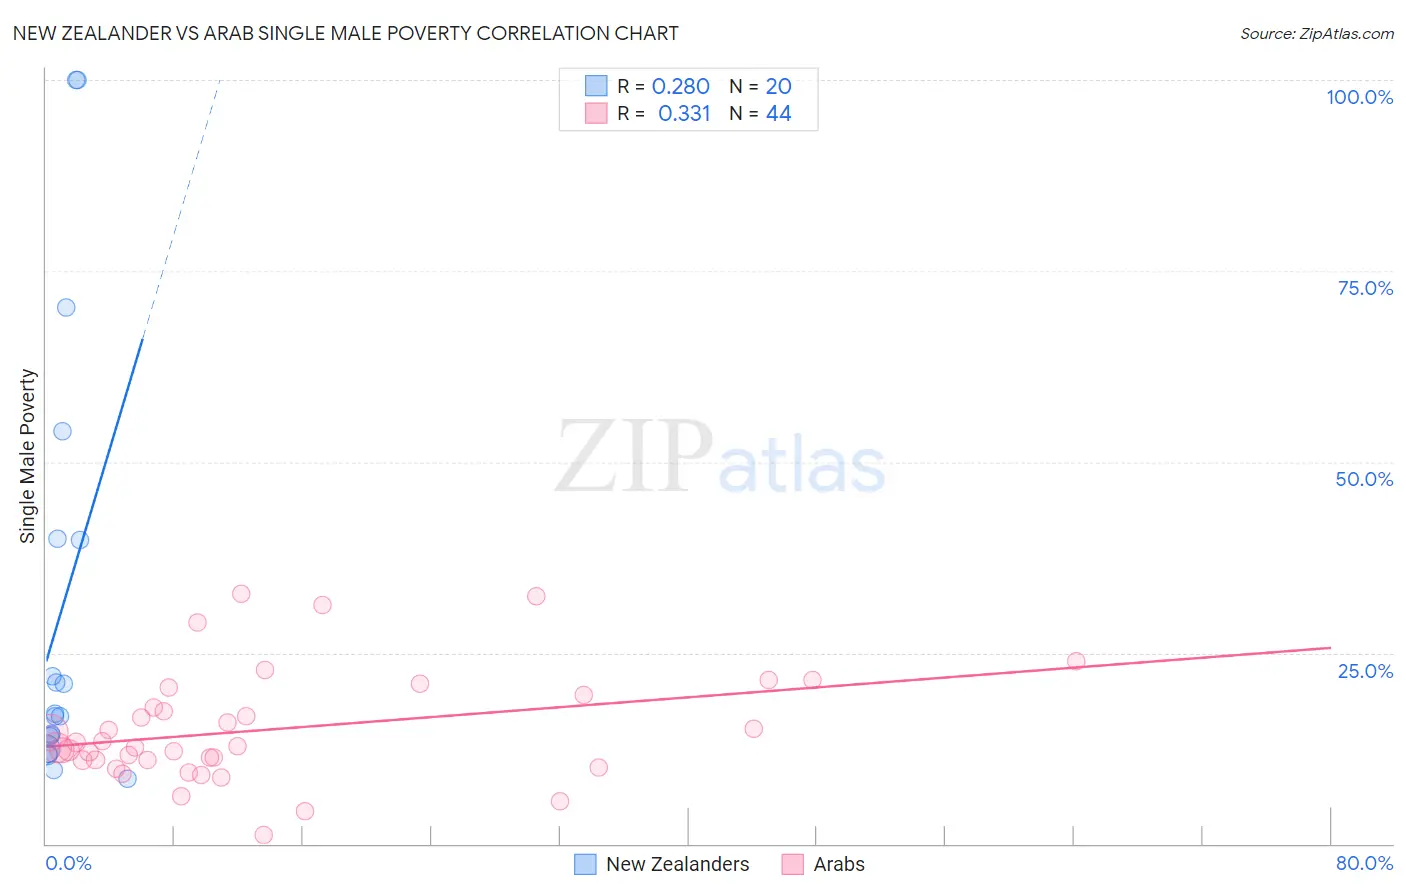
New Zealander vs Arab Single Male Poverty Correlation Chart
The statistical analysis conducted on geographies consisting of 101,681,215 people shows a weak positive correlation between the proportion of New Zealanders and poverty level among single males in the United States with a correlation coefficient (R) of 0.280 and weighted average of 13.2%. Similarly, the statistical analysis conducted on geographies consisting of 420,354,980 people shows a mild positive correlation between the proportion of Arabs and poverty level among single males in the United States with a correlation coefficient (R) of 0.331 and weighted average of 13.0%, a difference of 1.5%.
Single Male Poverty Correlation Summary
| Measurement | New Zealander | Arab |
| Minimum | 8.6% | 1.2% |
| Maximum | 100.0% | 32.8% |
| Range | 91.4% | 31.6% |
| Mean | 30.8% | 15.0% |
| Median | 16.9% | 12.7% |
| Interquartile 25% (IQ1) | 13.3% | 11.0% |
| Interquartile 75% (IQ3) | 39.9% | 18.7% |
| Interquartile Range (IQR) | 26.6% | 7.7% |
| Standard Deviation (Sample) | 28.6% | 7.2% |
| Standard Deviation (Population) | 27.9% | 7.1% |
Similar Demographics by Single Male Poverty
Demographics Similar to New Zealanders by Single Male Poverty
In terms of single male poverty, the demographic groups most similar to New Zealanders are Central American (13.2%, a difference of 0.020%), Immigrants from Western Europe (13.2%, a difference of 0.090%), Immigrants from the Azores (13.2%, a difference of 0.20%), Immigrants from Burma/Myanmar (13.1%, a difference of 0.24%), and Somali (13.2%, a difference of 0.24%).
| Demographics | Rating | Rank | Single Male Poverty |
| Zimbabweans | 14.9 /100 | #214 | Poor 13.1% |
| Japanese | 14.8 /100 | #215 | Poor 13.1% |
| Austrians | 13.9 /100 | #216 | Poor 13.1% |
| Bermudans | 13.0 /100 | #217 | Poor 13.1% |
| Scandinavians | 12.9 /100 | #218 | Poor 13.1% |
| Immigrants | Burma/Myanmar | 12.6 /100 | #219 | Poor 13.1% |
| Central Americans | 10.9 /100 | #220 | Poor 13.2% |
| New Zealanders | 10.7 /100 | #221 | Poor 13.2% |
| Immigrants | Western Europe | 10.0 /100 | #222 | Poor 13.2% |
| Immigrants | Azores | 9.3 /100 | #223 | Tragic 13.2% |
| Somalis | 9.1 /100 | #224 | Tragic 13.2% |
| Immigrants | Denmark | 8.7 /100 | #225 | Tragic 13.2% |
| Jamaicans | 7.7 /100 | #226 | Tragic 13.2% |
| Haitians | 7.0 /100 | #227 | Tragic 13.2% |
| Lebanese | 6.6 /100 | #228 | Tragic 13.2% |
Demographics Similar to Arabs by Single Male Poverty
In terms of single male poverty, the demographic groups most similar to Arabs are Immigrants from Thailand (13.0%, a difference of 0.030%), Immigrants from Jamaica (13.0%, a difference of 0.040%), Immigrants from South Africa (13.0%, a difference of 0.060%), Liberian (13.0%, a difference of 0.12%), and Portuguese (12.9%, a difference of 0.21%).
| Demographics | Rating | Rank | Single Male Poverty |
| Immigrants | West Indies | 33.0 /100 | #183 | Fair 12.9% |
| Immigrants | Trinidad and Tobago | 32.5 /100 | #184 | Fair 12.9% |
| Norwegians | 32.0 /100 | #185 | Fair 12.9% |
| Nigerians | 31.9 /100 | #186 | Fair 12.9% |
| Immigrants | Kuwait | 31.9 /100 | #187 | Fair 12.9% |
| Macedonians | 31.5 /100 | #188 | Fair 12.9% |
| Portuguese | 30.2 /100 | #189 | Fair 12.9% |
| Arabs | 27.0 /100 | #190 | Fair 13.0% |
| Immigrants | Thailand | 26.6 /100 | #191 | Fair 13.0% |
| Immigrants | Jamaica | 26.5 /100 | #192 | Fair 13.0% |
| Immigrants | South Africa | 26.1 /100 | #193 | Fair 13.0% |
| Liberians | 25.2 /100 | #194 | Fair 13.0% |
| Immigrants | England | 23.4 /100 | #195 | Fair 13.0% |
| Immigrants | Grenada | 23.1 /100 | #196 | Fair 13.0% |
| Immigrants | Laos | 23.1 /100 | #197 | Fair 13.0% |