New Zealander vs Arab Unemployment Among Women with Children Under 6 years
COMPARE
New Zealander
Arab
Unemployment Among Women with Children Under 6 years
Unemployment Among Women with Children Under 6 years Comparison
New Zealanders
Arabs
7.2%
UNEMPLOYMENT AMONG WOMEN WITH CHILDREN UNDER 6 YEARS
97.8/ 100
METRIC RATING
93rd/ 347
METRIC RANK
7.9%
UNEMPLOYMENT AMONG WOMEN WITH CHILDREN UNDER 6 YEARS
9.4/ 100
METRIC RATING
219th/ 347
METRIC RANK
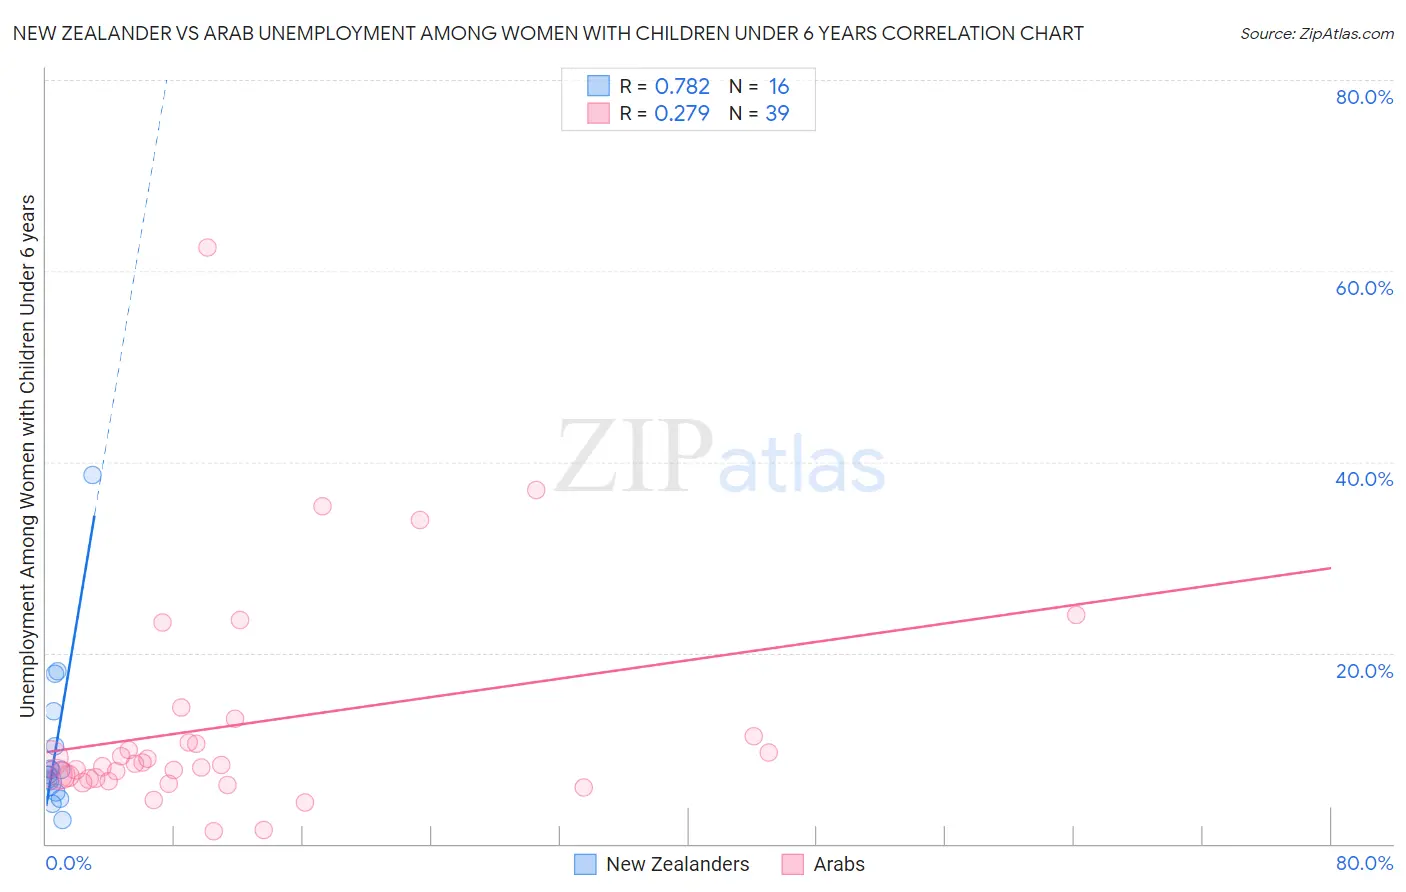
New Zealander vs Arab Unemployment Among Women with Children Under 6 years Correlation Chart
The statistical analysis conducted on geographies consisting of 97,246,920 people shows a strong positive correlation between the proportion of New Zealanders and unemployment rate among women with children under the age of 6 in the United States with a correlation coefficient (R) of 0.782 and weighted average of 7.2%. Similarly, the statistical analysis conducted on geographies consisting of 351,431,027 people shows a weak positive correlation between the proportion of Arabs and unemployment rate among women with children under the age of 6 in the United States with a correlation coefficient (R) of 0.279 and weighted average of 7.9%, a difference of 10.7%.
Unemployment Among Women with Children Under 6 years Correlation Summary
| Measurement | New Zealander | Arab |
| Minimum | 2.5% | 1.3% |
| Maximum | 38.6% | 62.5% |
| Range | 36.1% | 61.2% |
| Mean | 10.4% | 12.5% |
| Median | 7.4% | 8.3% |
| Interquartile 25% (IQ1) | 5.9% | 6.8% |
| Interquartile 75% (IQ3) | 12.1% | 11.3% |
| Interquartile Range (IQR) | 6.1% | 4.5% |
| Standard Deviation (Sample) | 8.8% | 11.9% |
| Standard Deviation (Population) | 8.5% | 11.8% |
Similar Demographics by Unemployment Among Women with Children Under 6 years
Demographics Similar to New Zealanders by Unemployment Among Women with Children Under 6 years
In terms of unemployment among women with children under 6 years, the demographic groups most similar to New Zealanders are Macedonian (7.2%, a difference of 0.070%), Romanian (7.2%, a difference of 0.11%), Immigrants from Eastern Africa (7.2%, a difference of 0.13%), Albanian (7.2%, a difference of 0.18%), and Immigrants from South Eastern Asia (7.2%, a difference of 0.20%).
| Demographics | Rating | Rank | Unemployment Among Women with Children Under 6 years |
| Immigrants | Zimbabwe | 98.6 /100 | #86 | Exceptional 7.1% |
| Alsatians | 98.4 /100 | #87 | Exceptional 7.1% |
| Immigrants | Hungary | 98.3 /100 | #88 | Exceptional 7.1% |
| Immigrants | Denmark | 98.3 /100 | #89 | Exceptional 7.1% |
| Immigrants | Spain | 98.2 /100 | #90 | Exceptional 7.1% |
| Danes | 98.2 /100 | #91 | Exceptional 7.1% |
| Albanians | 98.0 /100 | #92 | Exceptional 7.2% |
| New Zealanders | 97.8 /100 | #93 | Exceptional 7.2% |
| Macedonians | 97.7 /100 | #94 | Exceptional 7.2% |
| Romanians | 97.7 /100 | #95 | Exceptional 7.2% |
| Immigrants | Eastern Africa | 97.7 /100 | #96 | Exceptional 7.2% |
| Immigrants | South Eastern Asia | 97.6 /100 | #97 | Exceptional 7.2% |
| Russians | 97.5 /100 | #98 | Exceptional 7.2% |
| Immigrants | Europe | 97.5 /100 | #99 | Exceptional 7.2% |
| Immigrants | Northern Europe | 97.4 /100 | #100 | Exceptional 7.2% |
Demographics Similar to Arabs by Unemployment Among Women with Children Under 6 years
In terms of unemployment among women with children under 6 years, the demographic groups most similar to Arabs are South American Indian (7.9%, a difference of 0.020%), Moroccan (7.9%, a difference of 0.070%), Immigrants from Germany (7.9%, a difference of 0.17%), Immigrants from Nigeria (7.9%, a difference of 0.18%), and Samoan (7.9%, a difference of 0.19%).
| Demographics | Rating | Rank | Unemployment Among Women with Children Under 6 years |
| Swiss | 12.3 /100 | #212 | Poor 7.9% |
| Scottish | 11.4 /100 | #213 | Poor 7.9% |
| Spanish | 11.3 /100 | #214 | Poor 7.9% |
| Ecuadorians | 11.2 /100 | #215 | Poor 7.9% |
| Immigrants | Lebanon | 11.1 /100 | #216 | Poor 7.9% |
| Immigrants | Nigeria | 10.3 /100 | #217 | Poor 7.9% |
| Moroccans | 9.7 /100 | #218 | Tragic 7.9% |
| Arabs | 9.4 /100 | #219 | Tragic 7.9% |
| South American Indians | 9.3 /100 | #220 | Tragic 7.9% |
| Immigrants | Germany | 8.5 /100 | #221 | Tragic 7.9% |
| Samoans | 8.4 /100 | #222 | Tragic 7.9% |
| Carpatho Rusyns | 7.8 /100 | #223 | Tragic 8.0% |
| English | 7.2 /100 | #224 | Tragic 8.0% |
| Germans | 7.0 /100 | #225 | Tragic 8.0% |
| Senegalese | 6.2 /100 | #226 | Tragic 8.0% |