Nepalese vs Latvian Female Disability
COMPARE
Nepalese
Latvian
Female Disability
Female Disability Comparison
Nepalese
Latvians
13.3%
FEMALE DISABILITY
0.0/ 100
METRIC RATING
296th/ 347
METRIC RANK
11.7%
FEMALE DISABILITY
98.2/ 100
METRIC RATING
107th/ 347
METRIC RANK
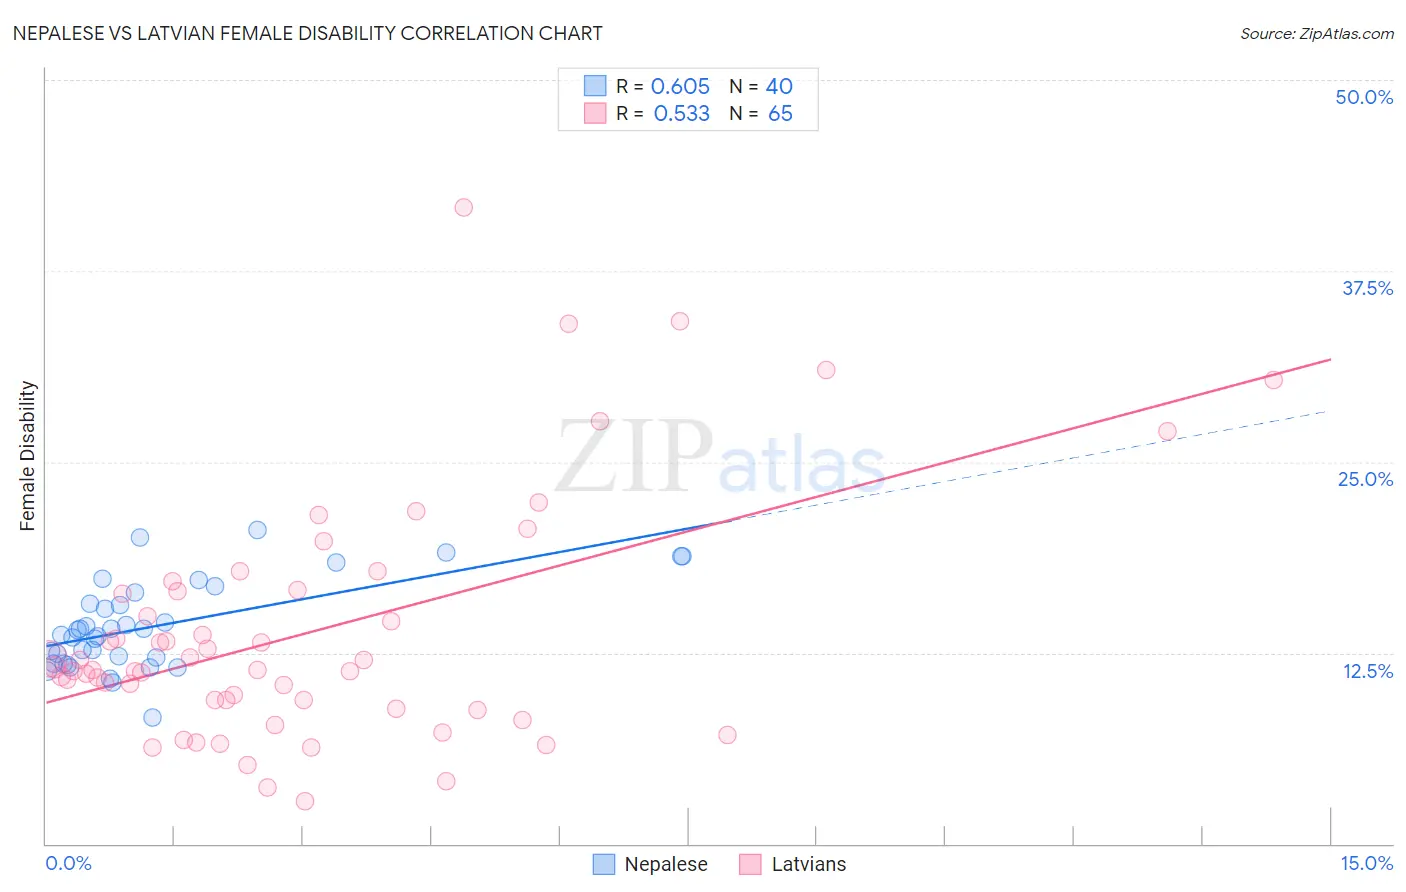
Nepalese vs Latvian Female Disability Correlation Chart
The statistical analysis conducted on geographies consisting of 24,521,755 people shows a significant positive correlation between the proportion of Nepalese and percentage of females with a disability in the United States with a correlation coefficient (R) of 0.605 and weighted average of 13.3%. Similarly, the statistical analysis conducted on geographies consisting of 220,713,826 people shows a substantial positive correlation between the proportion of Latvians and percentage of females with a disability in the United States with a correlation coefficient (R) of 0.533 and weighted average of 11.7%, a difference of 13.5%.
Female Disability Correlation Summary
| Measurement | Nepalese | Latvian |
| Minimum | 8.3% | 2.8% |
| Maximum | 20.5% | 41.7% |
| Range | 12.2% | 38.8% |
| Mean | 14.2% | 13.9% |
| Median | 13.8% | 11.4% |
| Interquartile 25% (IQ1) | 12.0% | 9.1% |
| Interquartile 75% (IQ3) | 16.1% | 16.6% |
| Interquartile Range (IQR) | 4.1% | 7.5% |
| Standard Deviation (Sample) | 2.9% | 7.9% |
| Standard Deviation (Population) | 2.8% | 7.8% |
Similar Demographics by Female Disability
Demographics Similar to Nepalese by Female Disability
In terms of female disability, the demographic groups most similar to Nepalese are Slovak (13.3%, a difference of 0.030%), French (13.3%, a difference of 0.14%), Celtic (13.3%, a difference of 0.34%), Nonimmigrants (13.4%, a difference of 0.34%), and Marshallese (13.3%, a difference of 0.39%).
| Demographics | Rating | Rank | Female Disability |
| Tlingit-Haida | 0.0 /100 | #289 | Tragic 13.2% |
| Immigrants | Yemen | 0.0 /100 | #290 | Tragic 13.2% |
| Shoshone | 0.0 /100 | #291 | Tragic 13.2% |
| Yakama | 0.0 /100 | #292 | Tragic 13.2% |
| Marshallese | 0.0 /100 | #293 | Tragic 13.3% |
| Celtics | 0.0 /100 | #294 | Tragic 13.3% |
| French | 0.0 /100 | #295 | Tragic 13.3% |
| Nepalese | 0.0 /100 | #296 | Tragic 13.3% |
| Slovaks | 0.0 /100 | #297 | Tragic 13.3% |
| Immigrants | Nonimmigrants | 0.0 /100 | #298 | Tragic 13.4% |
| Immigrants | Dominican Republic | 0.0 /100 | #299 | Tragic 13.4% |
| Pennsylvania Germans | 0.0 /100 | #300 | Tragic 13.4% |
| Africans | 0.0 /100 | #301 | Tragic 13.4% |
| Scotch-Irish | 0.0 /100 | #302 | Tragic 13.4% |
| Immigrants | Portugal | 0.0 /100 | #303 | Tragic 13.5% |
Demographics Similar to Latvians by Female Disability
In terms of female disability, the demographic groups most similar to Latvians are Immigrants from Greece (11.7%, a difference of 0.020%), New Zealander (11.7%, a difference of 0.020%), Australian (11.7%, a difference of 0.050%), Immigrants (11.7%, a difference of 0.050%), and Soviet Union (11.7%, a difference of 0.050%).
| Demographics | Rating | Rank | Female Disability |
| Immigrants | Uruguay | 98.5 /100 | #100 | Exceptional 11.7% |
| Immigrants | Costa Rica | 98.4 /100 | #101 | Exceptional 11.7% |
| Immigrants | South Eastern Asia | 98.4 /100 | #102 | Exceptional 11.7% |
| Immigrants | Eastern Africa | 98.3 /100 | #103 | Exceptional 11.7% |
| Immigrants | Western Asia | 98.3 /100 | #104 | Exceptional 11.7% |
| Australians | 98.3 /100 | #105 | Exceptional 11.7% |
| Immigrants | Greece | 98.2 /100 | #106 | Exceptional 11.7% |
| Latvians | 98.2 /100 | #107 | Exceptional 11.7% |
| New Zealanders | 98.1 /100 | #108 | Exceptional 11.7% |
| Immigrants | Immigrants | 98.1 /100 | #109 | Exceptional 11.7% |
| Soviet Union | 98.1 /100 | #110 | Exceptional 11.7% |
| Costa Ricans | 98.1 /100 | #111 | Exceptional 11.7% |
| Immigrants | Bangladesh | 97.8 /100 | #112 | Exceptional 11.8% |
| Immigrants | Belarus | 97.8 /100 | #113 | Exceptional 11.8% |
| South Africans | 97.7 /100 | #114 | Exceptional 11.8% |