Chippewa vs Latvian Female Disability
COMPARE
Chippewa
Latvian
Female Disability
Female Disability Comparison
Chippewa
Latvians
14.0%
FEMALE DISABILITY
0.0/ 100
METRIC RATING
317th/ 347
METRIC RANK
11.7%
FEMALE DISABILITY
98.2/ 100
METRIC RATING
107th/ 347
METRIC RANK
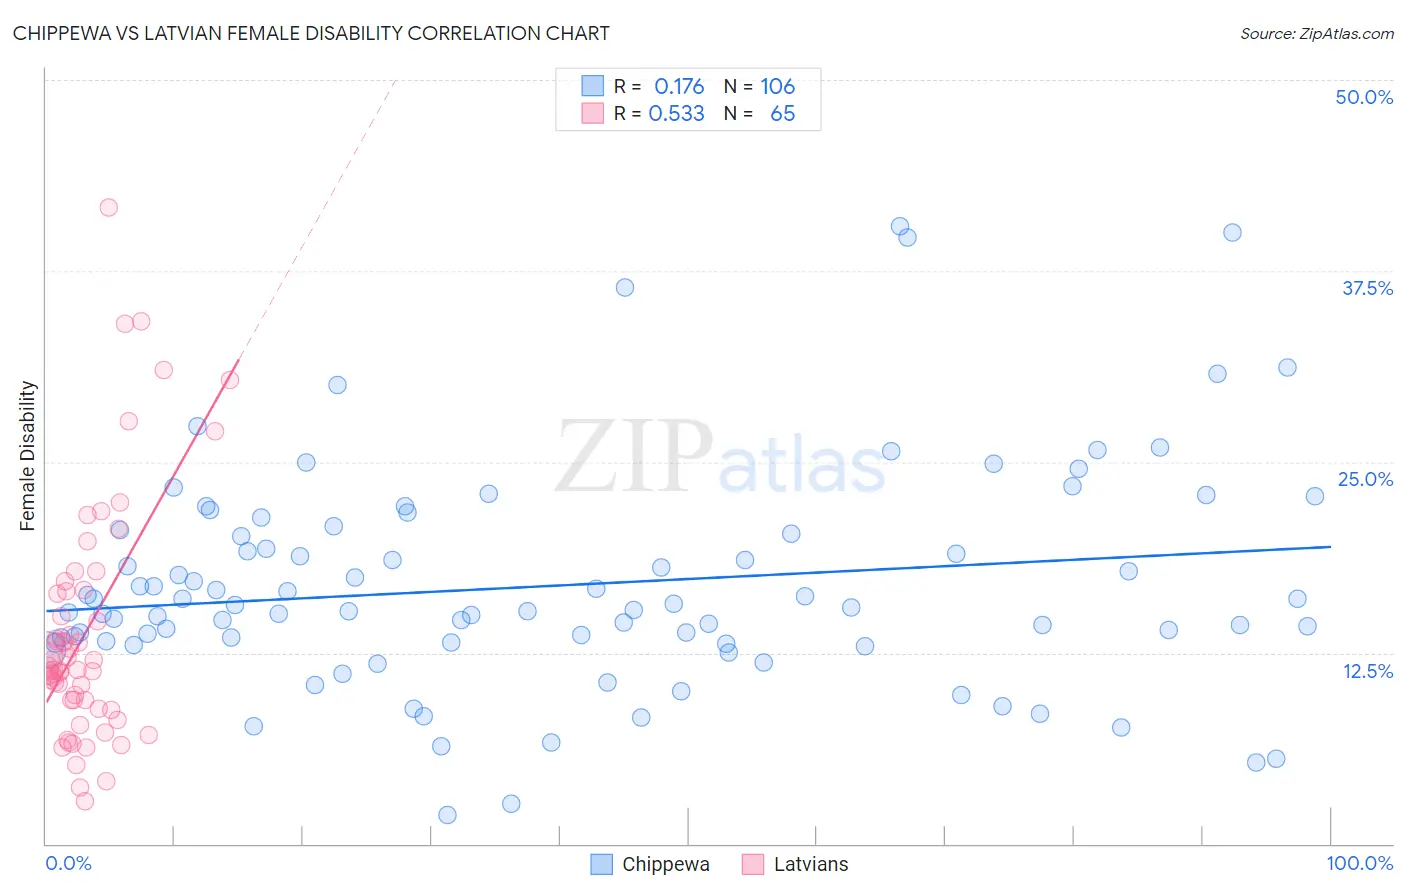
Chippewa vs Latvian Female Disability Correlation Chart
The statistical analysis conducted on geographies consisting of 215,042,988 people shows a poor positive correlation between the proportion of Chippewa and percentage of females with a disability in the United States with a correlation coefficient (R) of 0.176 and weighted average of 14.0%. Similarly, the statistical analysis conducted on geographies consisting of 220,713,826 people shows a substantial positive correlation between the proportion of Latvians and percentage of females with a disability in the United States with a correlation coefficient (R) of 0.533 and weighted average of 11.7%, a difference of 19.2%.
Female Disability Correlation Summary
| Measurement | Chippewa | Latvian |
| Minimum | 1.9% | 2.8% |
| Maximum | 40.4% | 41.7% |
| Range | 38.5% | 38.8% |
| Mean | 16.9% | 13.9% |
| Median | 15.4% | 11.4% |
| Interquartile 25% (IQ1) | 13.1% | 9.1% |
| Interquartile 75% (IQ3) | 20.3% | 16.6% |
| Interquartile Range (IQR) | 7.2% | 7.5% |
| Standard Deviation (Sample) | 7.2% | 7.9% |
| Standard Deviation (Population) | 7.2% | 7.8% |
Similar Demographics by Female Disability
Demographics Similar to Chippewa by Female Disability
In terms of female disability, the demographic groups most similar to Chippewa are Spanish American (14.0%, a difference of 0.11%), Paiute (14.0%, a difference of 0.11%), Iroquois (14.0%, a difference of 0.40%), Alaskan Athabascan (13.9%, a difference of 0.47%), and American (14.1%, a difference of 0.74%).
| Demographics | Rating | Rank | Female Disability |
| Apache | 0.0 /100 | #310 | Tragic 13.7% |
| Hopi | 0.0 /100 | #311 | Tragic 13.7% |
| Delaware | 0.0 /100 | #312 | Tragic 13.8% |
| Blackfeet | 0.0 /100 | #313 | Tragic 13.8% |
| Puget Sound Salish | 0.0 /100 | #314 | Tragic 13.8% |
| Alaskan Athabascans | 0.0 /100 | #315 | Tragic 13.9% |
| Spanish Americans | 0.0 /100 | #316 | Tragic 14.0% |
| Chippewa | 0.0 /100 | #317 | Tragic 14.0% |
| Paiute | 0.0 /100 | #318 | Tragic 14.0% |
| Iroquois | 0.0 /100 | #319 | Tragic 14.0% |
| Americans | 0.0 /100 | #320 | Tragic 14.1% |
| Potawatomi | 0.0 /100 | #321 | Tragic 14.1% |
| Pueblo | 0.0 /100 | #322 | Tragic 14.1% |
| Blacks/African Americans | 0.0 /100 | #323 | Tragic 14.1% |
| Natives/Alaskans | 0.0 /100 | #324 | Tragic 14.1% |
Demographics Similar to Latvians by Female Disability
In terms of female disability, the demographic groups most similar to Latvians are Immigrants from Greece (11.7%, a difference of 0.020%), New Zealander (11.7%, a difference of 0.020%), Australian (11.7%, a difference of 0.050%), Immigrants (11.7%, a difference of 0.050%), and Soviet Union (11.7%, a difference of 0.050%).
| Demographics | Rating | Rank | Female Disability |
| Immigrants | Uruguay | 98.5 /100 | #100 | Exceptional 11.7% |
| Immigrants | Costa Rica | 98.4 /100 | #101 | Exceptional 11.7% |
| Immigrants | South Eastern Asia | 98.4 /100 | #102 | Exceptional 11.7% |
| Immigrants | Eastern Africa | 98.3 /100 | #103 | Exceptional 11.7% |
| Immigrants | Western Asia | 98.3 /100 | #104 | Exceptional 11.7% |
| Australians | 98.3 /100 | #105 | Exceptional 11.7% |
| Immigrants | Greece | 98.2 /100 | #106 | Exceptional 11.7% |
| Latvians | 98.2 /100 | #107 | Exceptional 11.7% |
| New Zealanders | 98.1 /100 | #108 | Exceptional 11.7% |
| Immigrants | Immigrants | 98.1 /100 | #109 | Exceptional 11.7% |
| Soviet Union | 98.1 /100 | #110 | Exceptional 11.7% |
| Costa Ricans | 98.1 /100 | #111 | Exceptional 11.7% |
| Immigrants | Bangladesh | 97.8 /100 | #112 | Exceptional 11.8% |
| Immigrants | Belarus | 97.8 /100 | #113 | Exceptional 11.8% |
| South Africans | 97.7 /100 | #114 | Exceptional 11.8% |