Nepalese vs Immigrants from Cambodia Female Disability
COMPARE
Nepalese
Immigrants from Cambodia
Female Disability
Female Disability Comparison
Nepalese
Immigrants from Cambodia
13.3%
FEMALE DISABILITY
0.0/ 100
METRIC RATING
296th/ 347
METRIC RANK
12.5%
FEMALE DISABILITY
7.8/ 100
METRIC RATING
228th/ 347
METRIC RANK
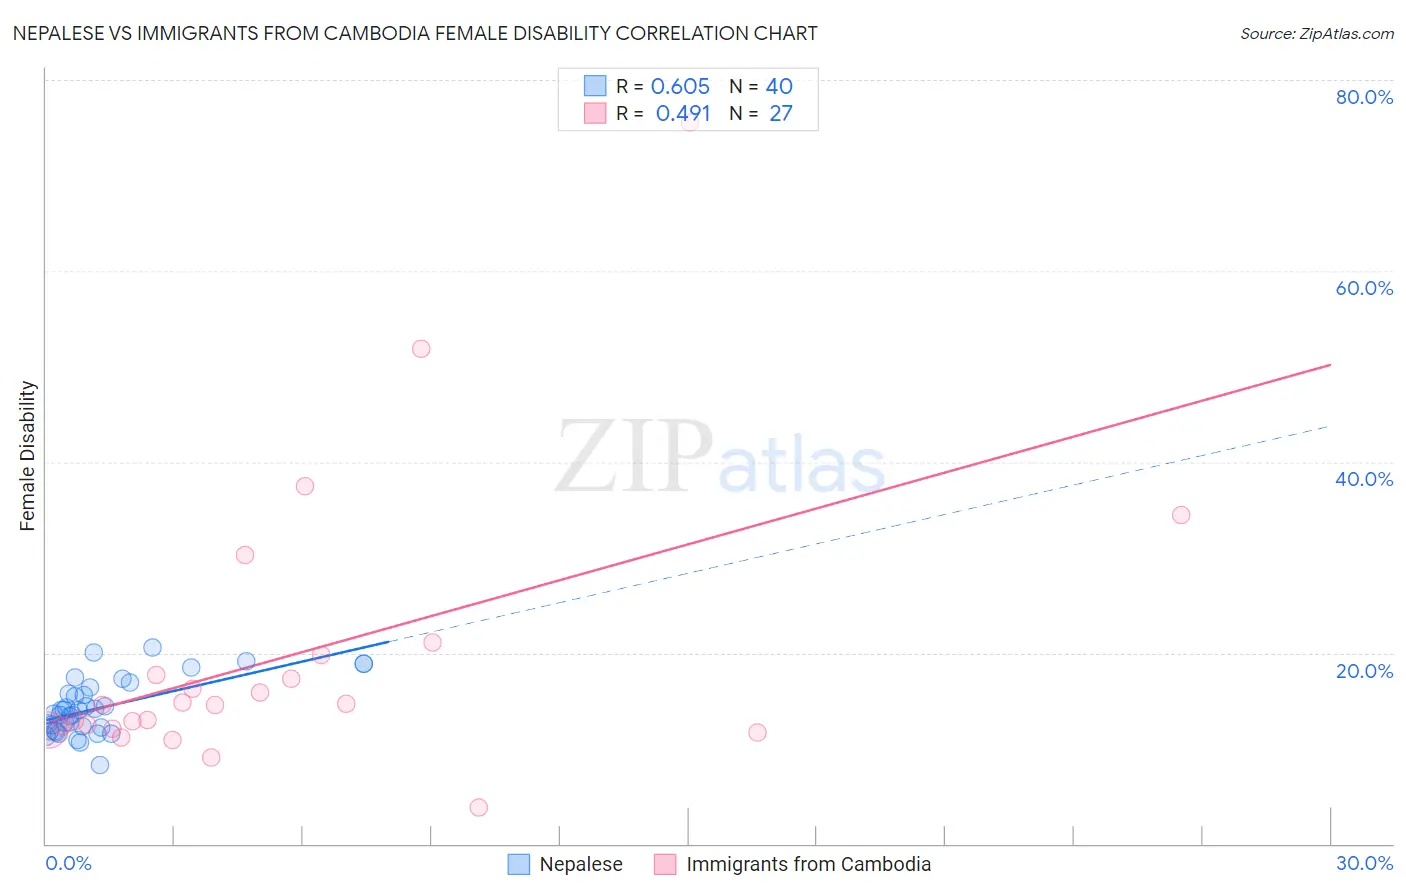
Nepalese vs Immigrants from Cambodia Female Disability Correlation Chart
The statistical analysis conducted on geographies consisting of 24,521,755 people shows a significant positive correlation between the proportion of Nepalese and percentage of females with a disability in the United States with a correlation coefficient (R) of 0.605 and weighted average of 13.3%. Similarly, the statistical analysis conducted on geographies consisting of 205,152,256 people shows a moderate positive correlation between the proportion of Immigrants from Cambodia and percentage of females with a disability in the United States with a correlation coefficient (R) of 0.491 and weighted average of 12.5%, a difference of 6.8%.
Female Disability Correlation Summary
| Measurement | Nepalese | Immigrants from Cambodia |
| Minimum | 8.3% | 3.8% |
| Maximum | 20.5% | 75.5% |
| Range | 12.2% | 71.7% |
| Mean | 14.2% | 19.6% |
| Median | 13.8% | 14.5% |
| Interquartile 25% (IQ1) | 12.0% | 12.0% |
| Interquartile 75% (IQ3) | 16.1% | 19.8% |
| Interquartile Range (IQR) | 4.1% | 7.8% |
| Standard Deviation (Sample) | 2.9% | 15.0% |
| Standard Deviation (Population) | 2.8% | 14.8% |
Similar Demographics by Female Disability
Demographics Similar to Nepalese by Female Disability
In terms of female disability, the demographic groups most similar to Nepalese are Slovak (13.3%, a difference of 0.030%), French (13.3%, a difference of 0.14%), Celtic (13.3%, a difference of 0.34%), Nonimmigrants (13.4%, a difference of 0.34%), and Marshallese (13.3%, a difference of 0.39%).
| Demographics | Rating | Rank | Female Disability |
| Tlingit-Haida | 0.0 /100 | #289 | Tragic 13.2% |
| Immigrants | Yemen | 0.0 /100 | #290 | Tragic 13.2% |
| Shoshone | 0.0 /100 | #291 | Tragic 13.2% |
| Yakama | 0.0 /100 | #292 | Tragic 13.2% |
| Marshallese | 0.0 /100 | #293 | Tragic 13.3% |
| Celtics | 0.0 /100 | #294 | Tragic 13.3% |
| French | 0.0 /100 | #295 | Tragic 13.3% |
| Nepalese | 0.0 /100 | #296 | Tragic 13.3% |
| Slovaks | 0.0 /100 | #297 | Tragic 13.3% |
| Immigrants | Nonimmigrants | 0.0 /100 | #298 | Tragic 13.4% |
| Immigrants | Dominican Republic | 0.0 /100 | #299 | Tragic 13.4% |
| Pennsylvania Germans | 0.0 /100 | #300 | Tragic 13.4% |
| Africans | 0.0 /100 | #301 | Tragic 13.4% |
| Scotch-Irish | 0.0 /100 | #302 | Tragic 13.4% |
| Immigrants | Portugal | 0.0 /100 | #303 | Tragic 13.5% |
Demographics Similar to Immigrants from Cambodia by Female Disability
In terms of female disability, the demographic groups most similar to Immigrants from Cambodia are Hispanic or Latino (12.5%, a difference of 0.030%), Assyrian/Chaldean/Syriac (12.5%, a difference of 0.030%), Hungarian (12.5%, a difference of 0.070%), Polish (12.5%, a difference of 0.080%), and Immigrants from Belize (12.5%, a difference of 0.11%).
| Demographics | Rating | Rank | Female Disability |
| Native Hawaiians | 10.8 /100 | #221 | Poor 12.4% |
| Italians | 10.7 /100 | #222 | Poor 12.4% |
| Guamanians/Chamorros | 9.5 /100 | #223 | Tragic 12.5% |
| Belizeans | 9.3 /100 | #224 | Tragic 12.5% |
| Poles | 8.4 /100 | #225 | Tragic 12.5% |
| Hispanics or Latinos | 8.0 /100 | #226 | Tragic 12.5% |
| Assyrians/Chaldeans/Syriacs | 8.0 /100 | #227 | Tragic 12.5% |
| Immigrants | Cambodia | 7.8 /100 | #228 | Tragic 12.5% |
| Hungarians | 7.2 /100 | #229 | Tragic 12.5% |
| Immigrants | Belize | 7.0 /100 | #230 | Tragic 12.5% |
| Belgians | 6.5 /100 | #231 | Tragic 12.5% |
| Immigrants | Somalia | 5.9 /100 | #232 | Tragic 12.5% |
| Immigrants | Iraq | 5.3 /100 | #233 | Tragic 12.5% |
| Scandinavians | 5.3 /100 | #234 | Tragic 12.5% |
| Malaysians | 5.0 /100 | #235 | Tragic 12.5% |