Nepalese vs Latvian Bachelor's Degree
COMPARE
Nepalese
Latvian
Bachelor's Degree
Bachelor's Degree Comparison
Nepalese
Latvians
29.9%
BACHELOR'S DEGREE
0.0/ 100
METRIC RATING
307th/ 347
METRIC RANK
46.1%
BACHELOR'S DEGREE
100.0/ 100
METRIC RATING
31st/ 347
METRIC RANK
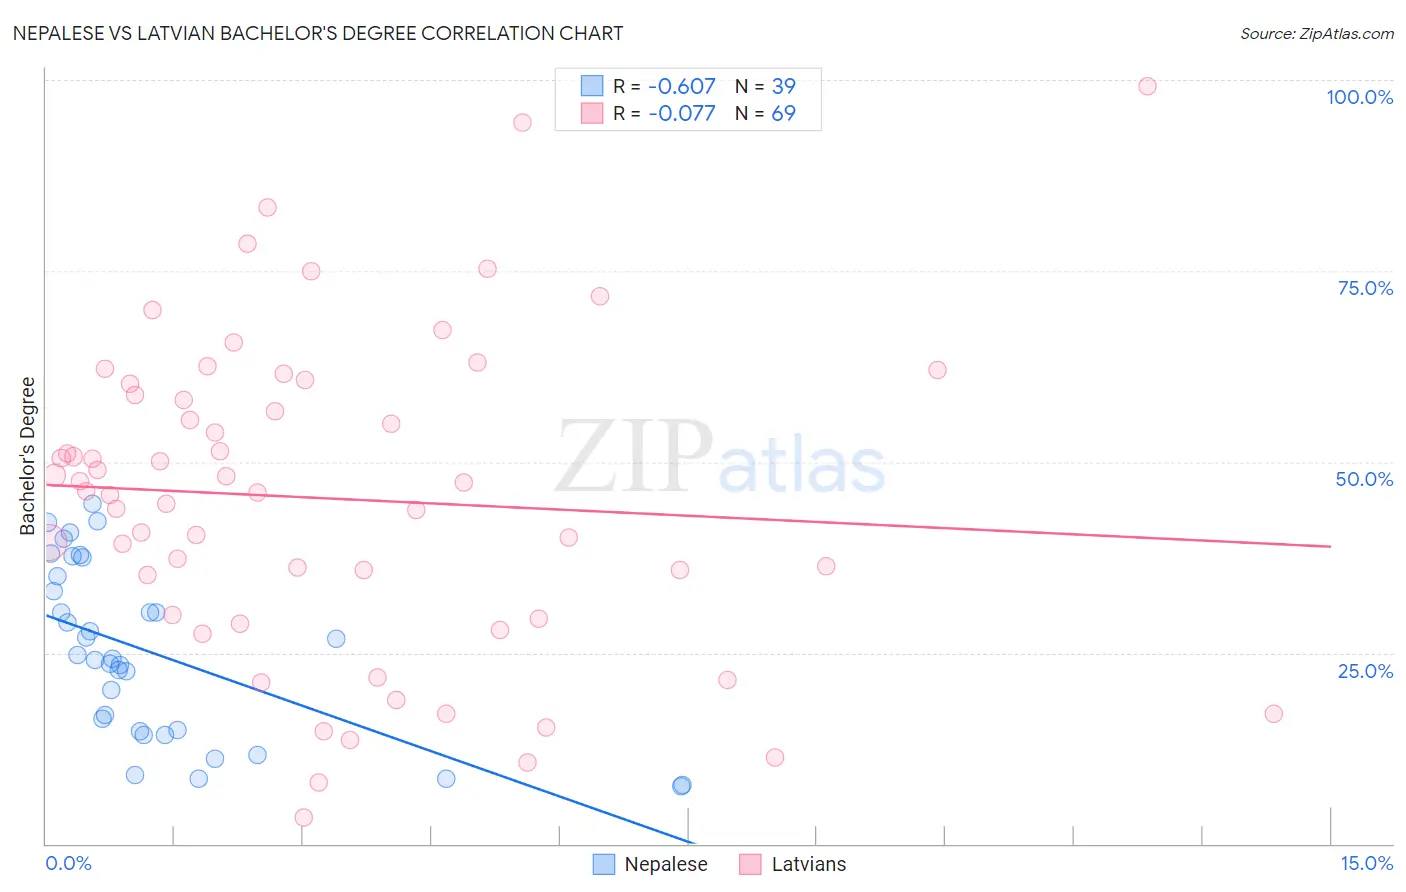
Nepalese vs Latvian Bachelor's Degree Correlation Chart
The statistical analysis conducted on geographies consisting of 24,519,269 people shows a significant negative correlation between the proportion of Nepalese and percentage of population with at least bachelor's degree education in the United States with a correlation coefficient (R) of -0.607 and weighted average of 29.9%. Similarly, the statistical analysis conducted on geographies consisting of 220,722,660 people shows a slight negative correlation between the proportion of Latvians and percentage of population with at least bachelor's degree education in the United States with a correlation coefficient (R) of -0.077 and weighted average of 46.1%, a difference of 54.2%.
Bachelor's Degree Correlation Summary
| Measurement | Nepalese | Latvian |
| Minimum | 7.6% | 3.4% |
| Maximum | 44.5% | 99.2% |
| Range | 36.9% | 95.8% |
| Mean | 24.9% | 45.2% |
| Median | 24.2% | 46.1% |
| Interquartile 25% (IQ1) | 14.8% | 29.7% |
| Interquartile 75% (IQ3) | 35.1% | 59.5% |
| Interquartile Range (IQR) | 20.3% | 29.8% |
| Standard Deviation (Sample) | 11.2% | 20.7% |
| Standard Deviation (Population) | 11.0% | 20.5% |
Similar Demographics by Bachelor's Degree
Demographics Similar to Nepalese by Bachelor's Degree
In terms of bachelor's degree, the demographic groups most similar to Nepalese are Immigrants from Yemen (29.9%, a difference of 0.040%), Immigrants from Latin America (30.1%, a difference of 0.58%), Cajun (29.6%, a difference of 0.86%), Bangladeshi (30.2%, a difference of 1.0%), and Cherokee (30.2%, a difference of 1.0%).
| Demographics | Rating | Rank | Bachelor's Degree |
| Immigrants | Micronesia | 0.0 /100 | #300 | Tragic 30.4% |
| Immigrants | Cuba | 0.0 /100 | #301 | Tragic 30.3% |
| Mexican American Indians | 0.0 /100 | #302 | Tragic 30.2% |
| Bangladeshis | 0.0 /100 | #303 | Tragic 30.2% |
| Cherokee | 0.0 /100 | #304 | Tragic 30.2% |
| Immigrants | Latin America | 0.0 /100 | #305 | Tragic 30.1% |
| Immigrants | Yemen | 0.0 /100 | #306 | Tragic 29.9% |
| Nepalese | 0.0 /100 | #307 | Tragic 29.9% |
| Cajuns | 0.0 /100 | #308 | Tragic 29.6% |
| Hispanics or Latinos | 0.0 /100 | #309 | Tragic 29.6% |
| Cheyenne | 0.0 /100 | #310 | Tragic 29.4% |
| Choctaw | 0.0 /100 | #311 | Tragic 29.4% |
| Seminole | 0.0 /100 | #312 | Tragic 29.4% |
| Alaska Natives | 0.0 /100 | #313 | Tragic 29.4% |
| Shoshone | 0.0 /100 | #314 | Tragic 29.3% |
Demographics Similar to Latvians by Bachelor's Degree
In terms of bachelor's degree, the demographic groups most similar to Latvians are Immigrants from Sri Lanka (46.1%, a difference of 0.040%), Israeli (46.1%, a difference of 0.090%), Turkish (46.2%, a difference of 0.22%), Immigrants from Turkey (46.0%, a difference of 0.30%), and Immigrants from France (46.4%, a difference of 0.68%).
| Demographics | Rating | Rank | Bachelor's Degree |
| Immigrants | Korea | 100.0 /100 | #24 | Exceptional 47.0% |
| Burmese | 100.0 /100 | #25 | Exceptional 46.9% |
| Immigrants | Japan | 100.0 /100 | #26 | Exceptional 46.8% |
| Immigrants | France | 100.0 /100 | #27 | Exceptional 46.4% |
| Turks | 100.0 /100 | #28 | Exceptional 46.2% |
| Israelis | 100.0 /100 | #29 | Exceptional 46.1% |
| Immigrants | Sri Lanka | 100.0 /100 | #30 | Exceptional 46.1% |
| Latvians | 100.0 /100 | #31 | Exceptional 46.1% |
| Immigrants | Turkey | 100.0 /100 | #32 | Exceptional 46.0% |
| Immigrants | Northern Europe | 100.0 /100 | #33 | Exceptional 45.6% |
| Immigrants | Denmark | 100.0 /100 | #34 | Exceptional 45.4% |
| Immigrants | Russia | 100.0 /100 | #35 | Exceptional 45.4% |
| Mongolians | 100.0 /100 | #36 | Exceptional 45.4% |
| Russians | 100.0 /100 | #37 | Exceptional 45.3% |
| Bulgarians | 100.0 /100 | #38 | Exceptional 45.3% |