Spanish vs Latvian Female Disability
COMPARE
Spanish
Latvian
Female Disability
Female Disability Comparison
Spanish
Latvians
13.0%
FEMALE DISABILITY
0.1/ 100
METRIC RATING
277th/ 347
METRIC RANK
11.7%
FEMALE DISABILITY
98.2/ 100
METRIC RATING
107th/ 347
METRIC RANK
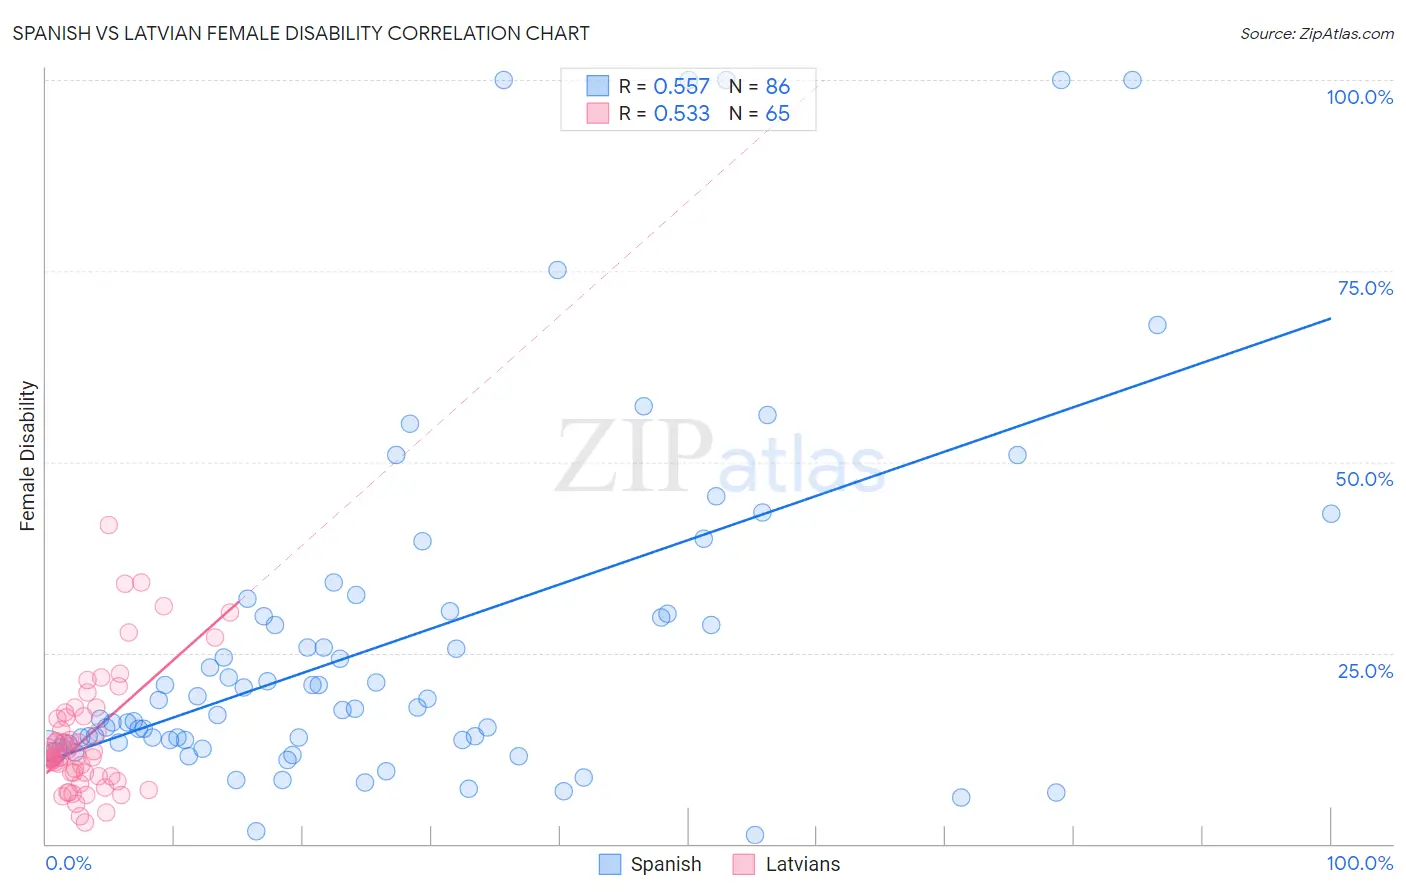
Spanish vs Latvian Female Disability Correlation Chart
The statistical analysis conducted on geographies consisting of 422,090,479 people shows a substantial positive correlation between the proportion of Spanish and percentage of females with a disability in the United States with a correlation coefficient (R) of 0.557 and weighted average of 13.0%. Similarly, the statistical analysis conducted on geographies consisting of 220,713,826 people shows a substantial positive correlation between the proportion of Latvians and percentage of females with a disability in the United States with a correlation coefficient (R) of 0.533 and weighted average of 11.7%, a difference of 10.8%.
Female Disability Correlation Summary
| Measurement | Spanish | Latvian |
| Minimum | 1.1% | 2.8% |
| Maximum | 100.0% | 41.7% |
| Range | 98.9% | 38.8% |
| Mean | 26.7% | 13.9% |
| Median | 17.7% | 11.4% |
| Interquartile 25% (IQ1) | 13.3% | 9.1% |
| Interquartile 75% (IQ3) | 30.0% | 16.6% |
| Interquartile Range (IQR) | 16.8% | 7.5% |
| Standard Deviation (Sample) | 23.4% | 7.9% |
| Standard Deviation (Population) | 23.2% | 7.8% |
Similar Demographics by Female Disability
Demographics Similar to Spanish by Female Disability
In terms of female disability, the demographic groups most similar to Spanish are Scottish (13.0%, a difference of 0.080%), Immigrants from Dominica (13.0%, a difference of 0.20%), Cheyenne (13.0%, a difference of 0.25%), Portuguese (13.0%, a difference of 0.31%), and Arapaho (13.0%, a difference of 0.33%).
| Demographics | Rating | Rank | Female Disability |
| Immigrants | Liberia | 0.3 /100 | #270 | Tragic 12.9% |
| Dutch | 0.2 /100 | #271 | Tragic 12.9% |
| Germans | 0.1 /100 | #272 | Tragic 12.9% |
| Sioux | 0.1 /100 | #273 | Tragic 12.9% |
| Portuguese | 0.1 /100 | #274 | Tragic 13.0% |
| Cheyenne | 0.1 /100 | #275 | Tragic 13.0% |
| Immigrants | Dominica | 0.1 /100 | #276 | Tragic 13.0% |
| Spanish | 0.1 /100 | #277 | Tragic 13.0% |
| Scottish | 0.1 /100 | #278 | Tragic 13.0% |
| Arapaho | 0.1 /100 | #279 | Tragic 13.0% |
| Irish | 0.1 /100 | #280 | Tragic 13.1% |
| U.S. Virgin Islanders | 0.1 /100 | #281 | Tragic 13.1% |
| Welsh | 0.0 /100 | #282 | Tragic 13.1% |
| English | 0.0 /100 | #283 | Tragic 13.1% |
| Hmong | 0.0 /100 | #284 | Tragic 13.1% |
Demographics Similar to Latvians by Female Disability
In terms of female disability, the demographic groups most similar to Latvians are Immigrants from Greece (11.7%, a difference of 0.020%), New Zealander (11.7%, a difference of 0.020%), Australian (11.7%, a difference of 0.050%), Immigrants (11.7%, a difference of 0.050%), and Soviet Union (11.7%, a difference of 0.050%).
| Demographics | Rating | Rank | Female Disability |
| Immigrants | Uruguay | 98.5 /100 | #100 | Exceptional 11.7% |
| Immigrants | Costa Rica | 98.4 /100 | #101 | Exceptional 11.7% |
| Immigrants | South Eastern Asia | 98.4 /100 | #102 | Exceptional 11.7% |
| Immigrants | Eastern Africa | 98.3 /100 | #103 | Exceptional 11.7% |
| Immigrants | Western Asia | 98.3 /100 | #104 | Exceptional 11.7% |
| Australians | 98.3 /100 | #105 | Exceptional 11.7% |
| Immigrants | Greece | 98.2 /100 | #106 | Exceptional 11.7% |
| Latvians | 98.2 /100 | #107 | Exceptional 11.7% |
| New Zealanders | 98.1 /100 | #108 | Exceptional 11.7% |
| Immigrants | Immigrants | 98.1 /100 | #109 | Exceptional 11.7% |
| Soviet Union | 98.1 /100 | #110 | Exceptional 11.7% |
| Costa Ricans | 98.1 /100 | #111 | Exceptional 11.7% |
| Immigrants | Bangladesh | 97.8 /100 | #112 | Exceptional 11.8% |
| Immigrants | Belarus | 97.8 /100 | #113 | Exceptional 11.8% |
| South Africans | 97.7 /100 | #114 | Exceptional 11.8% |