Palestinian vs Latvian Female Disability
COMPARE
Palestinian
Latvian
Female Disability
Female Disability Comparison
Palestinians
Latvians
11.6%
FEMALE DISABILITY
99.6/ 100
METRIC RATING
85th/ 347
METRIC RANK
11.7%
FEMALE DISABILITY
98.2/ 100
METRIC RATING
107th/ 347
METRIC RANK
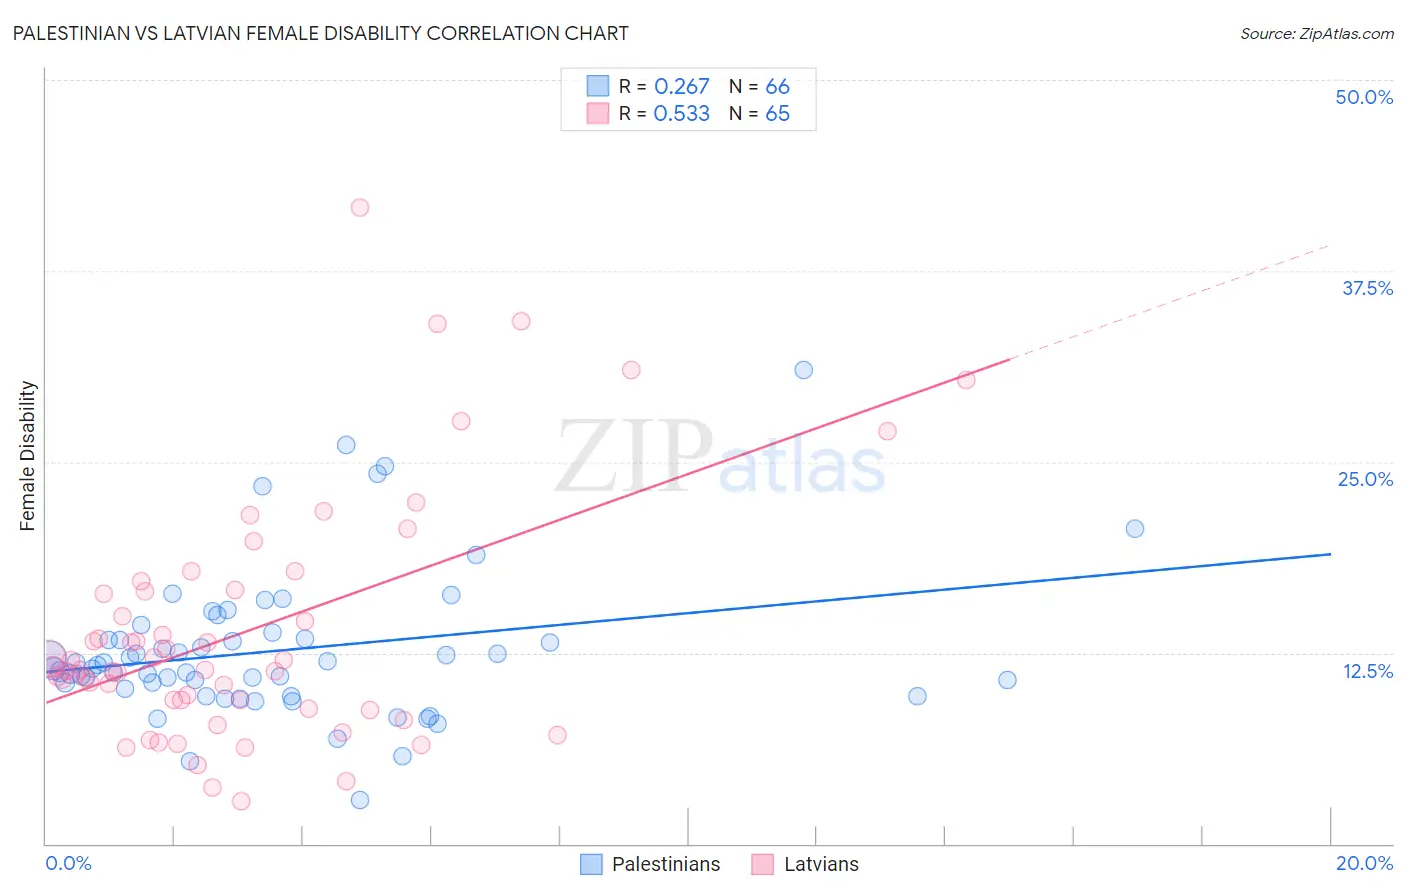
Palestinian vs Latvian Female Disability Correlation Chart
The statistical analysis conducted on geographies consisting of 216,463,404 people shows a weak positive correlation between the proportion of Palestinians and percentage of females with a disability in the United States with a correlation coefficient (R) of 0.267 and weighted average of 11.6%. Similarly, the statistical analysis conducted on geographies consisting of 220,713,826 people shows a substantial positive correlation between the proportion of Latvians and percentage of females with a disability in the United States with a correlation coefficient (R) of 0.533 and weighted average of 11.7%, a difference of 1.4%.
Female Disability Correlation Summary
| Measurement | Palestinian | Latvian |
| Minimum | 2.8% | 2.8% |
| Maximum | 31.0% | 41.7% |
| Range | 28.2% | 38.8% |
| Mean | 12.7% | 13.9% |
| Median | 11.6% | 11.4% |
| Interquartile 25% (IQ1) | 10.1% | 9.1% |
| Interquartile 75% (IQ3) | 13.4% | 16.6% |
| Interquartile Range (IQR) | 3.3% | 7.5% |
| Standard Deviation (Sample) | 4.9% | 7.9% |
| Standard Deviation (Population) | 4.8% | 7.8% |
Similar Demographics by Female Disability
Demographics Similar to Palestinians by Female Disability
In terms of female disability, the demographic groups most similar to Palestinians are Immigrants from Cameroon (11.6%, a difference of 0.0%), Immigrants from Poland (11.6%, a difference of 0.030%), Immigrants from Serbia (11.6%, a difference of 0.060%), Immigrants from Denmark (11.6%, a difference of 0.070%), and Yup'ik (11.6%, a difference of 0.070%).
| Demographics | Rating | Rank | Female Disability |
| Immigrants | South Africa | 99.7 /100 | #78 | Exceptional 11.5% |
| Sierra Leoneans | 99.7 /100 | #79 | Exceptional 11.5% |
| Immigrants | Jordan | 99.7 /100 | #80 | Exceptional 11.5% |
| Eastern Europeans | 99.7 /100 | #81 | Exceptional 11.5% |
| Luxembourgers | 99.6 /100 | #82 | Exceptional 11.6% |
| Immigrants | Serbia | 99.6 /100 | #83 | Exceptional 11.6% |
| Immigrants | Poland | 99.6 /100 | #84 | Exceptional 11.6% |
| Palestinians | 99.6 /100 | #85 | Exceptional 11.6% |
| Immigrants | Cameroon | 99.6 /100 | #86 | Exceptional 11.6% |
| Immigrants | Denmark | 99.5 /100 | #87 | Exceptional 11.6% |
| Yup'ik | 99.5 /100 | #88 | Exceptional 11.6% |
| Vietnamese | 99.5 /100 | #89 | Exceptional 11.6% |
| Immigrants | Romania | 99.5 /100 | #90 | Exceptional 11.6% |
| Immigrants | Zimbabwe | 99.5 /100 | #91 | Exceptional 11.6% |
| Immigrants | Czechoslovakia | 99.5 /100 | #92 | Exceptional 11.6% |
Demographics Similar to Latvians by Female Disability
In terms of female disability, the demographic groups most similar to Latvians are Immigrants from Greece (11.7%, a difference of 0.020%), New Zealander (11.7%, a difference of 0.020%), Australian (11.7%, a difference of 0.050%), Immigrants (11.7%, a difference of 0.050%), and Soviet Union (11.7%, a difference of 0.050%).
| Demographics | Rating | Rank | Female Disability |
| Immigrants | Uruguay | 98.5 /100 | #100 | Exceptional 11.7% |
| Immigrants | Costa Rica | 98.4 /100 | #101 | Exceptional 11.7% |
| Immigrants | South Eastern Asia | 98.4 /100 | #102 | Exceptional 11.7% |
| Immigrants | Eastern Africa | 98.3 /100 | #103 | Exceptional 11.7% |
| Immigrants | Western Asia | 98.3 /100 | #104 | Exceptional 11.7% |
| Australians | 98.3 /100 | #105 | Exceptional 11.7% |
| Immigrants | Greece | 98.2 /100 | #106 | Exceptional 11.7% |
| Latvians | 98.2 /100 | #107 | Exceptional 11.7% |
| New Zealanders | 98.1 /100 | #108 | Exceptional 11.7% |
| Immigrants | Immigrants | 98.1 /100 | #109 | Exceptional 11.7% |
| Soviet Union | 98.1 /100 | #110 | Exceptional 11.7% |
| Costa Ricans | 98.1 /100 | #111 | Exceptional 11.7% |
| Immigrants | Bangladesh | 97.8 /100 | #112 | Exceptional 11.8% |
| Immigrants | Belarus | 97.8 /100 | #113 | Exceptional 11.8% |
| South Africans | 97.7 /100 | #114 | Exceptional 11.8% |