Native/Alaskan vs South African Disability Age 35 to 64
COMPARE
Native/Alaskan
South African
Disability Age 35 to 64
Disability Age 35 to 64 Comparison
Natives/Alaskans
South Africans
15.3%
DISABILITY AGE 35 TO 64
0.0/ 100
METRIC RATING
326th/ 347
METRIC RANK
10.7%
DISABILITY AGE 35 TO 64
93.3/ 100
METRIC RATING
128th/ 347
METRIC RANK
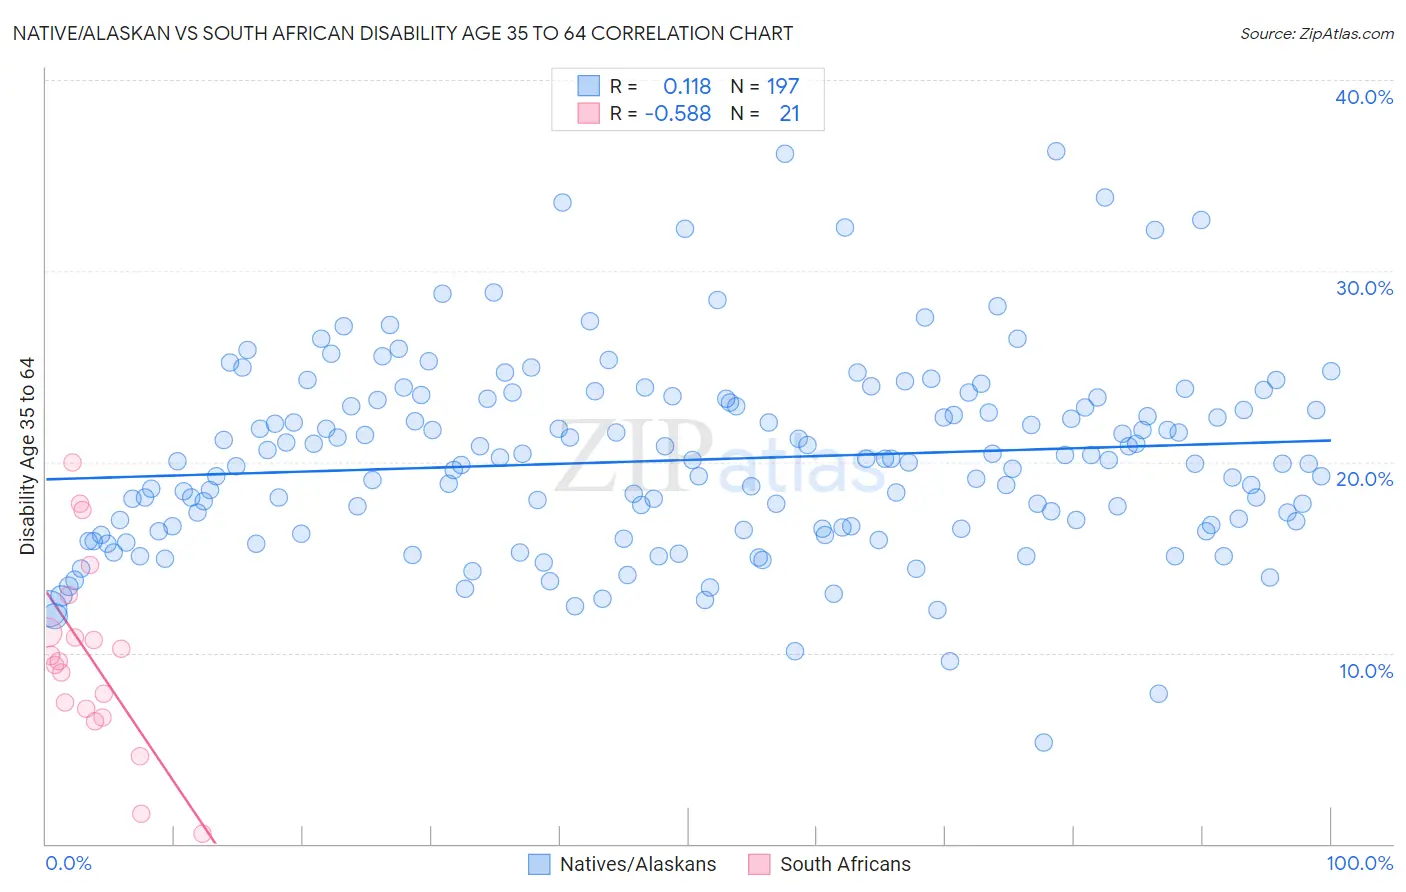
Native/Alaskan vs South African Disability Age 35 to 64 Correlation Chart
The statistical analysis conducted on geographies consisting of 512,516,181 people shows a poor positive correlation between the proportion of Natives/Alaskans and percentage of population with a disability between the ages 34 and 64 in the United States with a correlation coefficient (R) of 0.118 and weighted average of 15.3%. Similarly, the statistical analysis conducted on geographies consisting of 182,548,455 people shows a substantial negative correlation between the proportion of South Africans and percentage of population with a disability between the ages 34 and 64 in the United States with a correlation coefficient (R) of -0.588 and weighted average of 10.7%, a difference of 43.4%.
Disability Age 35 to 64 Correlation Summary
| Measurement | Native/Alaskan | South African |
| Minimum | 5.3% | 0.50% |
| Maximum | 36.2% | 19.9% |
| Range | 31.0% | 19.4% |
| Mean | 20.1% | 9.8% |
| Median | 20.0% | 9.5% |
| Interquartile 25% (IQ1) | 16.5% | 6.8% |
| Interquartile 75% (IQ3) | 23.2% | 12.0% |
| Interquartile Range (IQR) | 6.7% | 5.2% |
| Standard Deviation (Sample) | 5.0% | 4.9% |
| Standard Deviation (Population) | 5.0% | 4.8% |
Similar Demographics by Disability Age 35 to 64
Demographics Similar to Natives/Alaskans by Disability Age 35 to 64
In terms of disability age 35 to 64, the demographic groups most similar to Natives/Alaskans are Pueblo (15.3%, a difference of 0.020%), Cajun (15.3%, a difference of 0.20%), Cherokee (15.5%, a difference of 0.95%), Navajo (15.5%, a difference of 1.2%), and Arapaho (15.1%, a difference of 1.6%).
| Demographics | Rating | Rank | Disability Age 35 to 64 |
| Immigrants | Cabo Verde | 0.0 /100 | #319 | Tragic 14.7% |
| Blacks/African Americans | 0.0 /100 | #320 | Tragic 14.7% |
| Comanche | 0.0 /100 | #321 | Tragic 14.7% |
| Potawatomi | 0.0 /100 | #322 | Tragic 14.8% |
| Apache | 0.0 /100 | #323 | Tragic 14.9% |
| Chippewa | 0.0 /100 | #324 | Tragic 15.0% |
| Arapaho | 0.0 /100 | #325 | Tragic 15.1% |
| Natives/Alaskans | 0.0 /100 | #326 | Tragic 15.3% |
| Pueblo | 0.0 /100 | #327 | Tragic 15.3% |
| Cajuns | 0.0 /100 | #328 | Tragic 15.3% |
| Cherokee | 0.0 /100 | #329 | Tragic 15.5% |
| Navajo | 0.0 /100 | #330 | Tragic 15.5% |
| Dutch West Indians | 0.0 /100 | #331 | Tragic 15.6% |
| Alaskan Athabascans | 0.0 /100 | #332 | Tragic 15.7% |
| Yuman | 0.0 /100 | #333 | Tragic 15.8% |
Demographics Similar to South Africans by Disability Age 35 to 64
In terms of disability age 35 to 64, the demographic groups most similar to South Africans are Ecuadorian (10.7%, a difference of 0.080%), Immigrants from Syria (10.7%, a difference of 0.11%), Immigrants from El Salvador (10.7%, a difference of 0.16%), Immigrants from Zimbabwe (10.6%, a difference of 0.23%), and Immigrants from Albania (10.7%, a difference of 0.27%).
| Demographics | Rating | Rank | Disability Age 35 to 64 |
| Romanians | 95.0 /100 | #121 | Exceptional 10.6% |
| Immigrants | Norway | 95.0 /100 | #122 | Exceptional 10.6% |
| Maltese | 94.8 /100 | #123 | Exceptional 10.6% |
| Estonians | 94.5 /100 | #124 | Exceptional 10.6% |
| Albanians | 94.2 /100 | #125 | Exceptional 10.6% |
| Immigrants | Afghanistan | 94.1 /100 | #126 | Exceptional 10.6% |
| Immigrants | Zimbabwe | 94.0 /100 | #127 | Exceptional 10.6% |
| South Africans | 93.3 /100 | #128 | Exceptional 10.7% |
| Ecuadorians | 93.1 /100 | #129 | Exceptional 10.7% |
| Immigrants | Syria | 93.0 /100 | #130 | Exceptional 10.7% |
| Immigrants | El Salvador | 92.8 /100 | #131 | Exceptional 10.7% |
| Immigrants | Albania | 92.5 /100 | #132 | Exceptional 10.7% |
| Immigrants | Immigrants | 92.5 /100 | #133 | Exceptional 10.7% |
| Immigrants | Ecuador | 92.5 /100 | #134 | Exceptional 10.7% |
| Greeks | 92.3 /100 | #135 | Exceptional 10.7% |