Native/Alaskan vs Arab Disability Age 35 to 64
COMPARE
Native/Alaskan
Arab
Disability Age 35 to 64
Disability Age 35 to 64 Comparison
Natives/Alaskans
Arabs
15.3%
DISABILITY AGE 35 TO 64
0.0/ 100
METRIC RATING
326th/ 347
METRIC RANK
10.9%
DISABILITY AGE 35 TO 64
82.7/ 100
METRIC RATING
148th/ 347
METRIC RANK
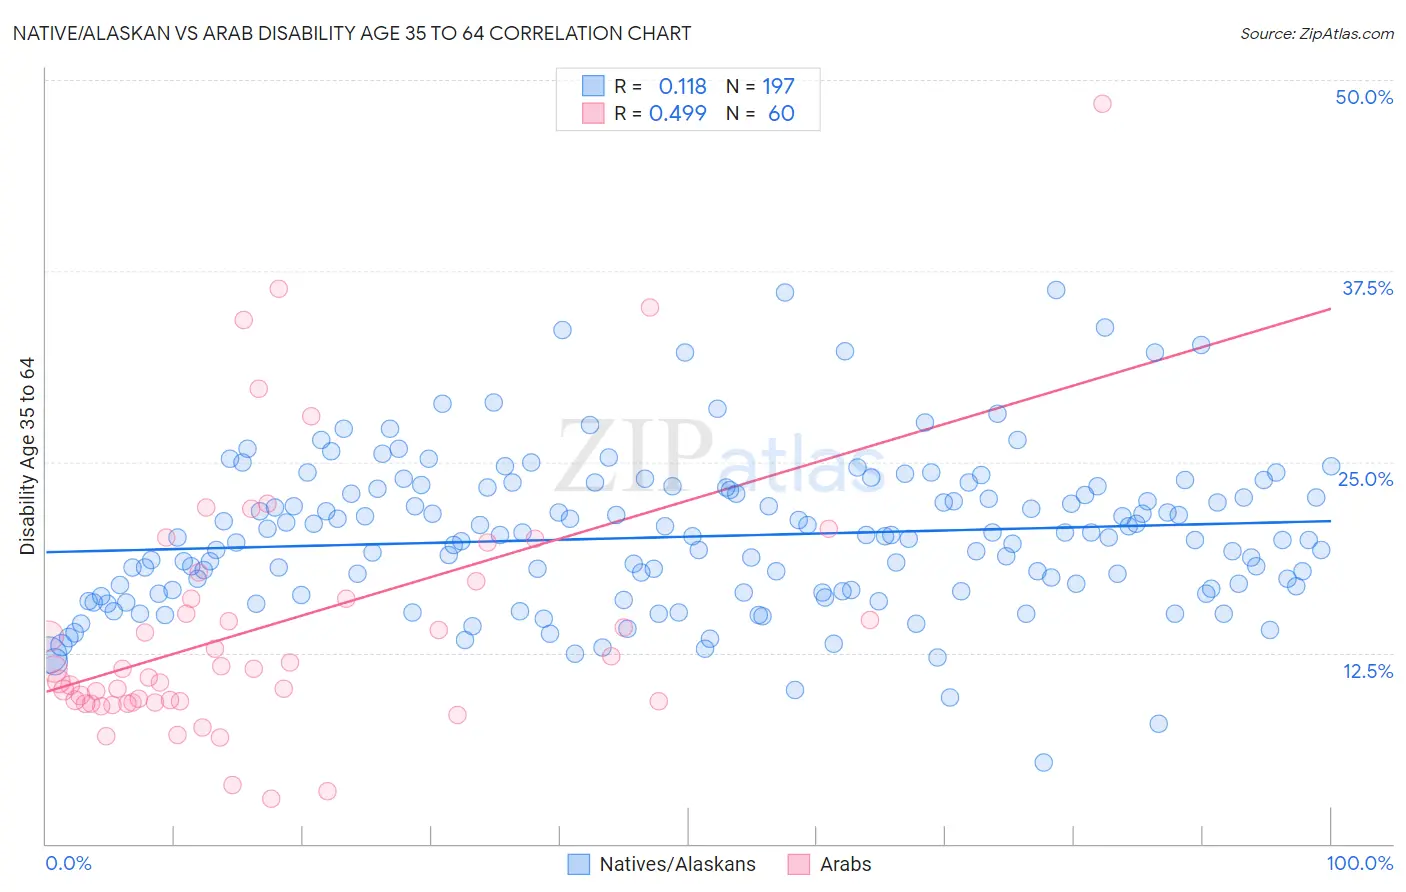
Native/Alaskan vs Arab Disability Age 35 to 64 Correlation Chart
The statistical analysis conducted on geographies consisting of 512,516,181 people shows a poor positive correlation between the proportion of Natives/Alaskans and percentage of population with a disability between the ages 34 and 64 in the United States with a correlation coefficient (R) of 0.118 and weighted average of 15.3%. Similarly, the statistical analysis conducted on geographies consisting of 486,294,602 people shows a moderate positive correlation between the proportion of Arabs and percentage of population with a disability between the ages 34 and 64 in the United States with a correlation coefficient (R) of 0.499 and weighted average of 10.9%, a difference of 40.2%.
Disability Age 35 to 64 Correlation Summary
| Measurement | Native/Alaskan | Arab |
| Minimum | 5.3% | 2.9% |
| Maximum | 36.2% | 48.5% |
| Range | 31.0% | 45.5% |
| Mean | 20.1% | 14.3% |
| Median | 20.0% | 11.4% |
| Interquartile 25% (IQ1) | 16.5% | 9.3% |
| Interquartile 75% (IQ3) | 23.2% | 16.6% |
| Interquartile Range (IQR) | 6.7% | 7.4% |
| Standard Deviation (Sample) | 5.0% | 8.6% |
| Standard Deviation (Population) | 5.0% | 8.5% |
Similar Demographics by Disability Age 35 to 64
Demographics Similar to Natives/Alaskans by Disability Age 35 to 64
In terms of disability age 35 to 64, the demographic groups most similar to Natives/Alaskans are Pueblo (15.3%, a difference of 0.020%), Cajun (15.3%, a difference of 0.20%), Cherokee (15.5%, a difference of 0.95%), Navajo (15.5%, a difference of 1.2%), and Arapaho (15.1%, a difference of 1.6%).
| Demographics | Rating | Rank | Disability Age 35 to 64 |
| Immigrants | Cabo Verde | 0.0 /100 | #319 | Tragic 14.7% |
| Blacks/African Americans | 0.0 /100 | #320 | Tragic 14.7% |
| Comanche | 0.0 /100 | #321 | Tragic 14.7% |
| Potawatomi | 0.0 /100 | #322 | Tragic 14.8% |
| Apache | 0.0 /100 | #323 | Tragic 14.9% |
| Chippewa | 0.0 /100 | #324 | Tragic 15.0% |
| Arapaho | 0.0 /100 | #325 | Tragic 15.1% |
| Natives/Alaskans | 0.0 /100 | #326 | Tragic 15.3% |
| Pueblo | 0.0 /100 | #327 | Tragic 15.3% |
| Cajuns | 0.0 /100 | #328 | Tragic 15.3% |
| Cherokee | 0.0 /100 | #329 | Tragic 15.5% |
| Navajo | 0.0 /100 | #330 | Tragic 15.5% |
| Dutch West Indians | 0.0 /100 | #331 | Tragic 15.6% |
| Alaskan Athabascans | 0.0 /100 | #332 | Tragic 15.7% |
| Yuman | 0.0 /100 | #333 | Tragic 15.8% |
Demographics Similar to Arabs by Disability Age 35 to 64
In terms of disability age 35 to 64, the demographic groups most similar to Arabs are Immigrants from Eritrea (10.9%, a difference of 0.10%), South American Indian (10.9%, a difference of 0.12%), Immigrants from Cameroon (10.9%, a difference of 0.22%), Syrian (11.0%, a difference of 0.40%), and Immigrants from Bangladesh (10.9%, a difference of 0.45%).
| Demographics | Rating | Rank | Disability Age 35 to 64 |
| Australians | 90.7 /100 | #141 | Exceptional 10.8% |
| Immigrants | Saudi Arabia | 90.6 /100 | #142 | Exceptional 10.8% |
| Sierra Leoneans | 89.7 /100 | #143 | Excellent 10.8% |
| Lithuanians | 88.7 /100 | #144 | Excellent 10.8% |
| Immigrants | Bangladesh | 85.6 /100 | #145 | Excellent 10.9% |
| South American Indians | 83.5 /100 | #146 | Excellent 10.9% |
| Immigrants | Eritrea | 83.4 /100 | #147 | Excellent 10.9% |
| Arabs | 82.7 /100 | #148 | Excellent 10.9% |
| Immigrants | Cameroon | 81.1 /100 | #149 | Excellent 10.9% |
| Syrians | 79.8 /100 | #150 | Good 11.0% |
| New Zealanders | 79.3 /100 | #151 | Good 11.0% |
| Ukrainians | 78.0 /100 | #152 | Good 11.0% |
| Immigrants | England | 77.4 /100 | #153 | Good 11.0% |
| Immigrants | Canada | 76.7 /100 | #154 | Good 11.0% |
| Moroccans | 76.4 /100 | #155 | Good 11.0% |