Native/Alaskan vs Mongolian Disability Age 35 to 64
COMPARE
Native/Alaskan
Mongolian
Disability Age 35 to 64
Disability Age 35 to 64 Comparison
Natives/Alaskans
Mongolians
15.3%
DISABILITY AGE 35 TO 64
0.0/ 100
METRIC RATING
326th/ 347
METRIC RANK
10.1%
DISABILITY AGE 35 TO 64
99.4/ 100
METRIC RATING
77th/ 347
METRIC RANK
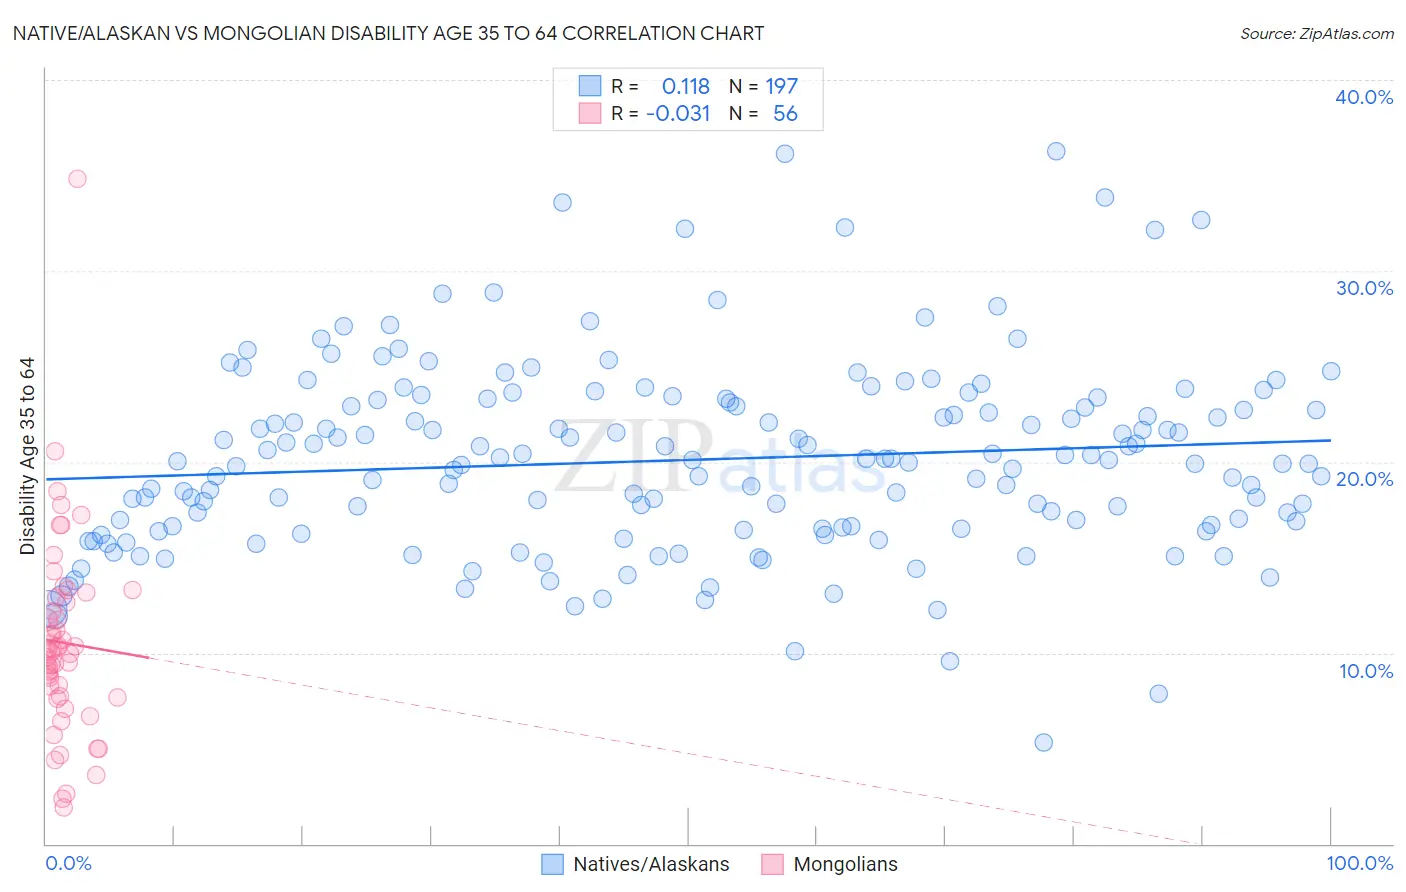
Native/Alaskan vs Mongolian Disability Age 35 to 64 Correlation Chart
The statistical analysis conducted on geographies consisting of 512,516,181 people shows a poor positive correlation between the proportion of Natives/Alaskans and percentage of population with a disability between the ages 34 and 64 in the United States with a correlation coefficient (R) of 0.118 and weighted average of 15.3%. Similarly, the statistical analysis conducted on geographies consisting of 140,298,014 people shows no correlation between the proportion of Mongolians and percentage of population with a disability between the ages 34 and 64 in the United States with a correlation coefficient (R) of -0.031 and weighted average of 10.1%, a difference of 51.2%.
Disability Age 35 to 64 Correlation Summary
| Measurement | Native/Alaskan | Mongolian |
| Minimum | 5.3% | 1.9% |
| Maximum | 36.2% | 34.8% |
| Range | 31.0% | 32.9% |
| Mean | 20.1% | 10.5% |
| Median | 20.0% | 10.1% |
| Interquartile 25% (IQ1) | 16.5% | 7.7% |
| Interquartile 75% (IQ3) | 23.2% | 12.8% |
| Interquartile Range (IQR) | 6.7% | 5.1% |
| Standard Deviation (Sample) | 5.0% | 5.2% |
| Standard Deviation (Population) | 5.0% | 5.2% |
Similar Demographics by Disability Age 35 to 64
Demographics Similar to Natives/Alaskans by Disability Age 35 to 64
In terms of disability age 35 to 64, the demographic groups most similar to Natives/Alaskans are Pueblo (15.3%, a difference of 0.020%), Cajun (15.3%, a difference of 0.20%), Cherokee (15.5%, a difference of 0.95%), Navajo (15.5%, a difference of 1.2%), and Arapaho (15.1%, a difference of 1.6%).
| Demographics | Rating | Rank | Disability Age 35 to 64 |
| Immigrants | Cabo Verde | 0.0 /100 | #319 | Tragic 14.7% |
| Blacks/African Americans | 0.0 /100 | #320 | Tragic 14.7% |
| Comanche | 0.0 /100 | #321 | Tragic 14.7% |
| Potawatomi | 0.0 /100 | #322 | Tragic 14.8% |
| Apache | 0.0 /100 | #323 | Tragic 14.9% |
| Chippewa | 0.0 /100 | #324 | Tragic 15.0% |
| Arapaho | 0.0 /100 | #325 | Tragic 15.1% |
| Natives/Alaskans | 0.0 /100 | #326 | Tragic 15.3% |
| Pueblo | 0.0 /100 | #327 | Tragic 15.3% |
| Cajuns | 0.0 /100 | #328 | Tragic 15.3% |
| Cherokee | 0.0 /100 | #329 | Tragic 15.5% |
| Navajo | 0.0 /100 | #330 | Tragic 15.5% |
| Dutch West Indians | 0.0 /100 | #331 | Tragic 15.6% |
| Alaskan Athabascans | 0.0 /100 | #332 | Tragic 15.7% |
| Yuman | 0.0 /100 | #333 | Tragic 15.8% |
Demographics Similar to Mongolians by Disability Age 35 to 64
In terms of disability age 35 to 64, the demographic groups most similar to Mongolians are Immigrants from Chile (10.1%, a difference of 0.030%), Immigrants from Latvia (10.1%, a difference of 0.040%), Laotian (10.1%, a difference of 0.14%), Jordanian (10.1%, a difference of 0.14%), and Immigrants from Vietnam (10.1%, a difference of 0.21%).
| Demographics | Rating | Rank | Disability Age 35 to 64 |
| Immigrants | Nicaragua | 99.5 /100 | #70 | Exceptional 10.1% |
| Immigrants | Kazakhstan | 99.5 /100 | #71 | Exceptional 10.1% |
| Immigrants | Northern Europe | 99.5 /100 | #72 | Exceptional 10.1% |
| Immigrants | France | 99.5 /100 | #73 | Exceptional 10.1% |
| Laotians | 99.4 /100 | #74 | Exceptional 10.1% |
| Immigrants | Latvia | 99.4 /100 | #75 | Exceptional 10.1% |
| Immigrants | Chile | 99.4 /100 | #76 | Exceptional 10.1% |
| Mongolians | 99.4 /100 | #77 | Exceptional 10.1% |
| Jordanians | 99.3 /100 | #78 | Exceptional 10.1% |
| Immigrants | Vietnam | 99.3 /100 | #79 | Exceptional 10.1% |
| Immigrants | Croatia | 99.3 /100 | #80 | Exceptional 10.2% |
| Latvians | 99.2 /100 | #81 | Exceptional 10.2% |
| Russians | 99.2 /100 | #82 | Exceptional 10.2% |
| Immigrants | Brazil | 99.2 /100 | #83 | Exceptional 10.2% |
| Sri Lankans | 99.2 /100 | #84 | Exceptional 10.2% |