Native/Alaskan vs Turkish Disability Age 35 to 64
COMPARE
Native/Alaskan
Turkish
Disability Age 35 to 64
Disability Age 35 to 64 Comparison
Natives/Alaskans
Turks
15.3%
DISABILITY AGE 35 TO 64
0.0/ 100
METRIC RATING
326th/ 347
METRIC RANK
9.7%
DISABILITY AGE 35 TO 64
99.9/ 100
METRIC RATING
32nd/ 347
METRIC RANK
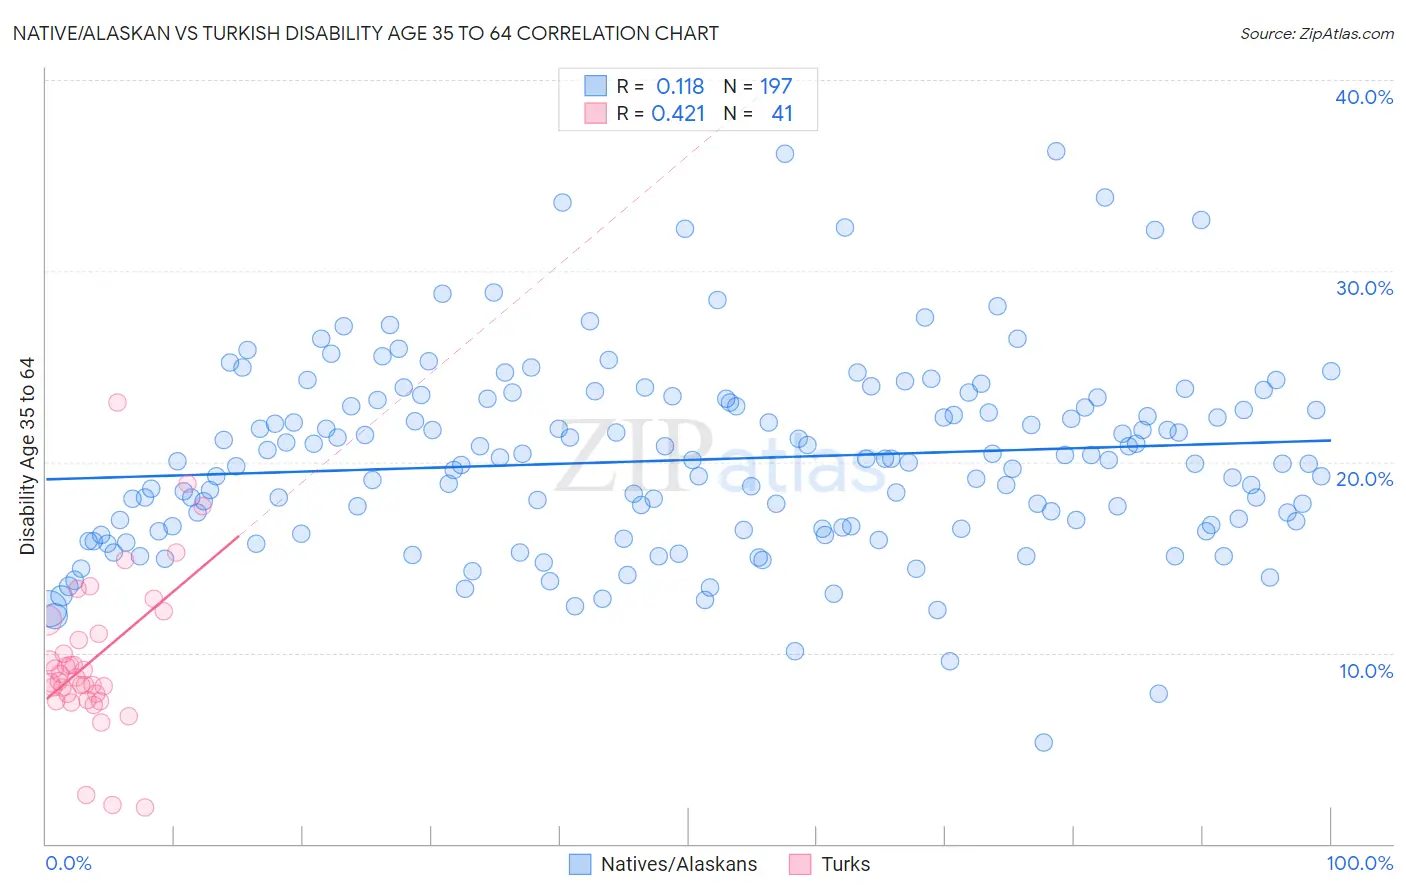
Native/Alaskan vs Turkish Disability Age 35 to 64 Correlation Chart
The statistical analysis conducted on geographies consisting of 512,516,181 people shows a poor positive correlation between the proportion of Natives/Alaskans and percentage of population with a disability between the ages 34 and 64 in the United States with a correlation coefficient (R) of 0.118 and weighted average of 15.3%. Similarly, the statistical analysis conducted on geographies consisting of 271,671,610 people shows a moderate positive correlation between the proportion of Turks and percentage of population with a disability between the ages 34 and 64 in the United States with a correlation coefficient (R) of 0.421 and weighted average of 9.7%, a difference of 58.6%.
Disability Age 35 to 64 Correlation Summary
| Measurement | Native/Alaskan | Turkish |
| Minimum | 5.3% | 1.9% |
| Maximum | 36.2% | 23.1% |
| Range | 31.0% | 21.2% |
| Mean | 20.1% | 9.7% |
| Median | 20.0% | 8.7% |
| Interquartile 25% (IQ1) | 16.5% | 7.7% |
| Interquartile 75% (IQ3) | 23.2% | 11.3% |
| Interquartile Range (IQR) | 6.7% | 3.6% |
| Standard Deviation (Sample) | 5.0% | 4.1% |
| Standard Deviation (Population) | 5.0% | 4.1% |
Similar Demographics by Disability Age 35 to 64
Demographics Similar to Natives/Alaskans by Disability Age 35 to 64
In terms of disability age 35 to 64, the demographic groups most similar to Natives/Alaskans are Pueblo (15.3%, a difference of 0.020%), Cajun (15.3%, a difference of 0.20%), Cherokee (15.5%, a difference of 0.95%), Navajo (15.5%, a difference of 1.2%), and Arapaho (15.1%, a difference of 1.6%).
| Demographics | Rating | Rank | Disability Age 35 to 64 |
| Immigrants | Cabo Verde | 0.0 /100 | #319 | Tragic 14.7% |
| Blacks/African Americans | 0.0 /100 | #320 | Tragic 14.7% |
| Comanche | 0.0 /100 | #321 | Tragic 14.7% |
| Potawatomi | 0.0 /100 | #322 | Tragic 14.8% |
| Apache | 0.0 /100 | #323 | Tragic 14.9% |
| Chippewa | 0.0 /100 | #324 | Tragic 15.0% |
| Arapaho | 0.0 /100 | #325 | Tragic 15.1% |
| Natives/Alaskans | 0.0 /100 | #326 | Tragic 15.3% |
| Pueblo | 0.0 /100 | #327 | Tragic 15.3% |
| Cajuns | 0.0 /100 | #328 | Tragic 15.3% |
| Cherokee | 0.0 /100 | #329 | Tragic 15.5% |
| Navajo | 0.0 /100 | #330 | Tragic 15.5% |
| Dutch West Indians | 0.0 /100 | #331 | Tragic 15.6% |
| Alaskan Athabascans | 0.0 /100 | #332 | Tragic 15.7% |
| Yuman | 0.0 /100 | #333 | Tragic 15.8% |
Demographics Similar to Turks by Disability Age 35 to 64
In terms of disability age 35 to 64, the demographic groups most similar to Turks are Immigrants from Indonesia (9.7%, a difference of 0.070%), Immigrants from Australia (9.7%, a difference of 0.15%), Bulgarian (9.7%, a difference of 0.25%), Immigrants from Cuba (9.7%, a difference of 0.28%), and Immigrants from Turkey (9.7%, a difference of 0.36%).
| Demographics | Rating | Rank | Disability Age 35 to 64 |
| Venezuelans | 100.0 /100 | #25 | Exceptional 9.4% |
| Immigrants | Sri Lanka | 100.0 /100 | #26 | Exceptional 9.5% |
| Immigrants | Asia | 100.0 /100 | #27 | Exceptional 9.5% |
| Immigrants | Pakistan | 100.0 /100 | #28 | Exceptional 9.5% |
| Immigrants | Ireland | 100.0 /100 | #29 | Exceptional 9.5% |
| Immigrants | Japan | 100.0 /100 | #30 | Exceptional 9.5% |
| Immigrants | Lithuania | 99.9 /100 | #31 | Exceptional 9.6% |
| Turks | 99.9 /100 | #32 | Exceptional 9.7% |
| Immigrants | Indonesia | 99.9 /100 | #33 | Exceptional 9.7% |
| Immigrants | Australia | 99.9 /100 | #34 | Exceptional 9.7% |
| Bulgarians | 99.9 /100 | #35 | Exceptional 9.7% |
| Immigrants | Cuba | 99.9 /100 | #36 | Exceptional 9.7% |
| Immigrants | Turkey | 99.9 /100 | #37 | Exceptional 9.7% |
| Egyptians | 99.9 /100 | #38 | Exceptional 9.7% |
| Immigrants | Belarus | 99.9 /100 | #39 | Exceptional 9.7% |