Native/Alaskan vs Iranian Disability Age 35 to 64
COMPARE
Native/Alaskan
Iranian
Disability Age 35 to 64
Disability Age 35 to 64 Comparison
Natives/Alaskans
Iranians
15.3%
DISABILITY AGE 35 TO 64
0.0/ 100
METRIC RATING
326th/ 347
METRIC RANK
8.7%
DISABILITY AGE 35 TO 64
100.0/ 100
METRIC RATING
8th/ 347
METRIC RANK
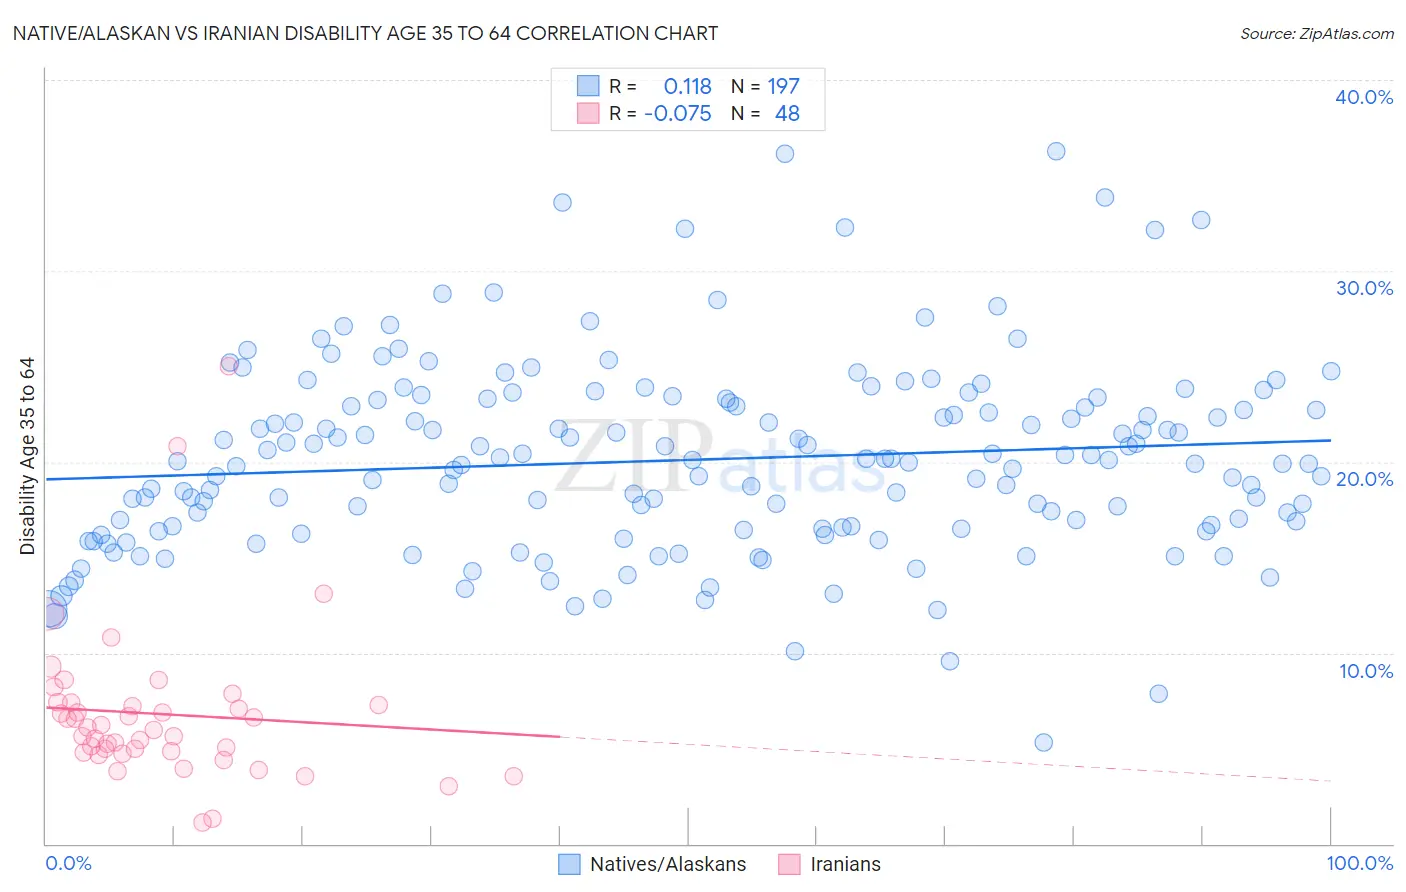
Native/Alaskan vs Iranian Disability Age 35 to 64 Correlation Chart
The statistical analysis conducted on geographies consisting of 512,516,181 people shows a poor positive correlation between the proportion of Natives/Alaskans and percentage of population with a disability between the ages 34 and 64 in the United States with a correlation coefficient (R) of 0.118 and weighted average of 15.3%. Similarly, the statistical analysis conducted on geographies consisting of 316,627,091 people shows a slight negative correlation between the proportion of Iranians and percentage of population with a disability between the ages 34 and 64 in the United States with a correlation coefficient (R) of -0.075 and weighted average of 8.7%, a difference of 76.7%.
Disability Age 35 to 64 Correlation Summary
| Measurement | Native/Alaskan | Iranian |
| Minimum | 5.3% | 1.1% |
| Maximum | 36.2% | 25.0% |
| Range | 31.0% | 23.9% |
| Mean | 20.1% | 6.8% |
| Median | 20.0% | 6.0% |
| Interquartile 25% (IQ1) | 16.5% | 4.8% |
| Interquartile 75% (IQ3) | 23.2% | 7.3% |
| Interquartile Range (IQR) | 6.7% | 2.5% |
| Standard Deviation (Sample) | 5.0% | 4.1% |
| Standard Deviation (Population) | 5.0% | 4.1% |
Similar Demographics by Disability Age 35 to 64
Demographics Similar to Natives/Alaskans by Disability Age 35 to 64
In terms of disability age 35 to 64, the demographic groups most similar to Natives/Alaskans are Pueblo (15.3%, a difference of 0.020%), Cajun (15.3%, a difference of 0.20%), Cherokee (15.5%, a difference of 0.95%), Navajo (15.5%, a difference of 1.2%), and Arapaho (15.1%, a difference of 1.6%).
| Demographics | Rating | Rank | Disability Age 35 to 64 |
| Immigrants | Cabo Verde | 0.0 /100 | #319 | Tragic 14.7% |
| Blacks/African Americans | 0.0 /100 | #320 | Tragic 14.7% |
| Comanche | 0.0 /100 | #321 | Tragic 14.7% |
| Potawatomi | 0.0 /100 | #322 | Tragic 14.8% |
| Apache | 0.0 /100 | #323 | Tragic 14.9% |
| Chippewa | 0.0 /100 | #324 | Tragic 15.0% |
| Arapaho | 0.0 /100 | #325 | Tragic 15.1% |
| Natives/Alaskans | 0.0 /100 | #326 | Tragic 15.3% |
| Pueblo | 0.0 /100 | #327 | Tragic 15.3% |
| Cajuns | 0.0 /100 | #328 | Tragic 15.3% |
| Cherokee | 0.0 /100 | #329 | Tragic 15.5% |
| Navajo | 0.0 /100 | #330 | Tragic 15.5% |
| Dutch West Indians | 0.0 /100 | #331 | Tragic 15.6% |
| Alaskan Athabascans | 0.0 /100 | #332 | Tragic 15.7% |
| Yuman | 0.0 /100 | #333 | Tragic 15.8% |
Demographics Similar to Iranians by Disability Age 35 to 64
In terms of disability age 35 to 64, the demographic groups most similar to Iranians are Immigrants from China (8.7%, a difference of 0.43%), Immigrants from Israel (8.6%, a difference of 0.58%), Immigrants from Bolivia (8.7%, a difference of 0.70%), Thai (8.6%, a difference of 1.0%), and Immigrants from Eastern Asia (8.8%, a difference of 1.4%).
| Demographics | Rating | Rank | Disability Age 35 to 64 |
| Immigrants | Taiwan | 100.0 /100 | #1 | Exceptional 7.8% |
| Filipinos | 100.0 /100 | #2 | Exceptional 8.0% |
| Immigrants | Hong Kong | 100.0 /100 | #3 | Exceptional 8.2% |
| Immigrants | India | 100.0 /100 | #4 | Exceptional 8.3% |
| Immigrants | Iran | 100.0 /100 | #5 | Exceptional 8.5% |
| Thais | 100.0 /100 | #6 | Exceptional 8.6% |
| Immigrants | Israel | 100.0 /100 | #7 | Exceptional 8.6% |
| Iranians | 100.0 /100 | #8 | Exceptional 8.7% |
| Immigrants | China | 100.0 /100 | #9 | Exceptional 8.7% |
| Immigrants | Bolivia | 100.0 /100 | #10 | Exceptional 8.7% |
| Immigrants | Eastern Asia | 100.0 /100 | #11 | Exceptional 8.8% |
| Indians (Asian) | 100.0 /100 | #12 | Exceptional 8.9% |
| Immigrants | South Central Asia | 100.0 /100 | #13 | Exceptional 8.9% |
| Immigrants | Singapore | 100.0 /100 | #14 | Exceptional 8.9% |
| Bolivians | 100.0 /100 | #15 | Exceptional 8.9% |