Native/Alaskan vs Welsh Disability Age 35 to 64
COMPARE
Native/Alaskan
Welsh
Disability Age 35 to 64
Disability Age 35 to 64 Comparison
Natives/Alaskans
Welsh
15.3%
DISABILITY AGE 35 TO 64
0.0/ 100
METRIC RATING
326th/ 347
METRIC RANK
12.4%
DISABILITY AGE 35 TO 64
0.6/ 100
METRIC RATING
258th/ 347
METRIC RANK
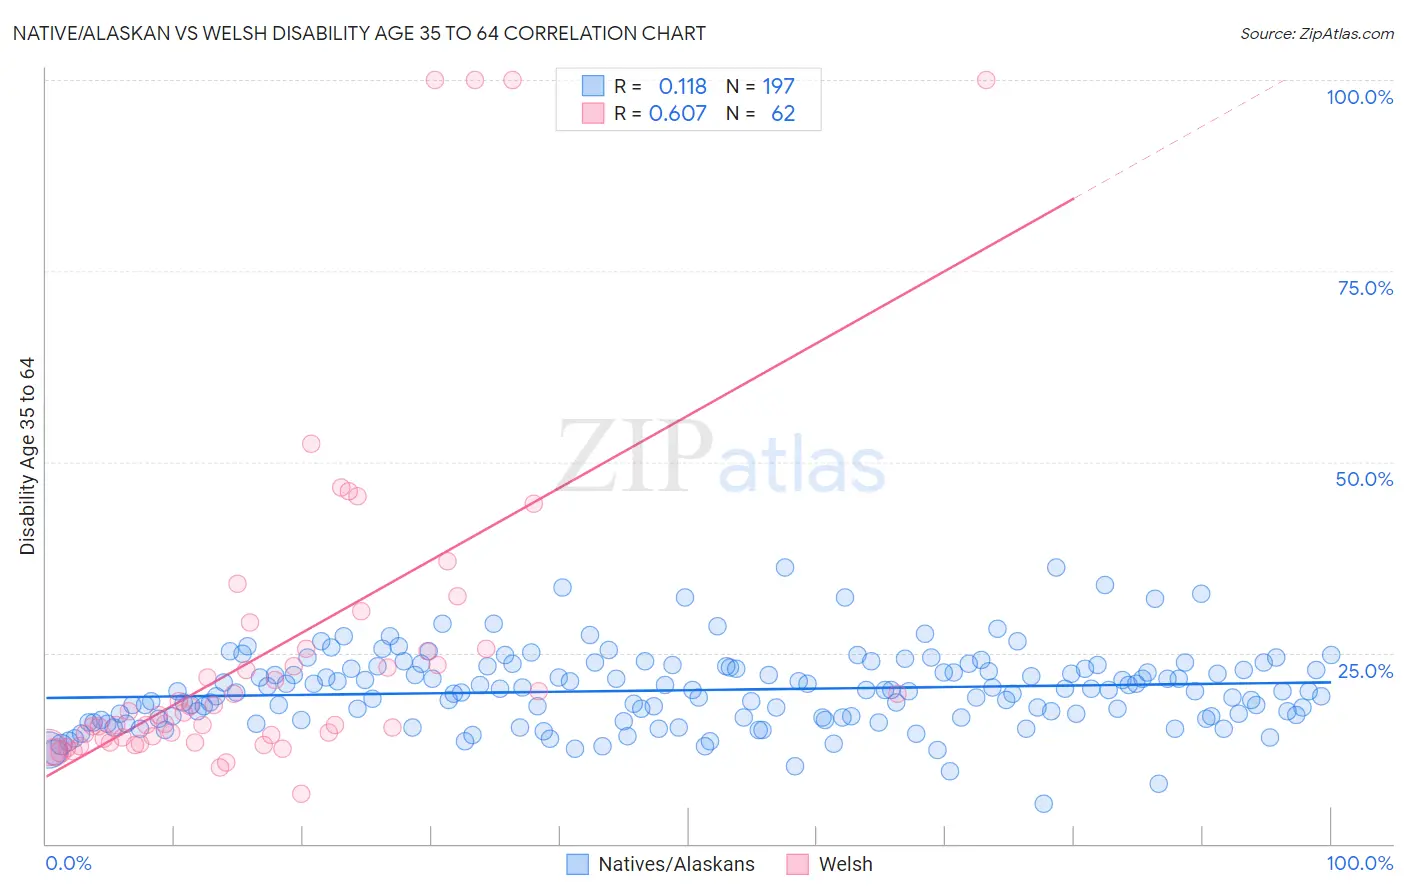
Native/Alaskan vs Welsh Disability Age 35 to 64 Correlation Chart
The statistical analysis conducted on geographies consisting of 512,516,181 people shows a poor positive correlation between the proportion of Natives/Alaskans and percentage of population with a disability between the ages 34 and 64 in the United States with a correlation coefficient (R) of 0.118 and weighted average of 15.3%. Similarly, the statistical analysis conducted on geographies consisting of 527,956,367 people shows a significant positive correlation between the proportion of Welsh and percentage of population with a disability between the ages 34 and 64 in the United States with a correlation coefficient (R) of 0.607 and weighted average of 12.4%, a difference of 23.3%.
Disability Age 35 to 64 Correlation Summary
| Measurement | Native/Alaskan | Welsh |
| Minimum | 5.3% | 6.5% |
| Maximum | 36.2% | 100.0% |
| Range | 31.0% | 93.5% |
| Mean | 20.1% | 25.5% |
| Median | 20.0% | 17.0% |
| Interquartile 25% (IQ1) | 16.5% | 13.8% |
| Interquartile 75% (IQ3) | 23.2% | 25.5% |
| Interquartile Range (IQR) | 6.7% | 11.7% |
| Standard Deviation (Sample) | 5.0% | 22.1% |
| Standard Deviation (Population) | 5.0% | 21.9% |
Similar Demographics by Disability Age 35 to 64
Demographics Similar to Natives/Alaskans by Disability Age 35 to 64
In terms of disability age 35 to 64, the demographic groups most similar to Natives/Alaskans are Pueblo (15.3%, a difference of 0.020%), Cajun (15.3%, a difference of 0.20%), Cherokee (15.5%, a difference of 0.95%), Navajo (15.5%, a difference of 1.2%), and Arapaho (15.1%, a difference of 1.6%).
| Demographics | Rating | Rank | Disability Age 35 to 64 |
| Immigrants | Cabo Verde | 0.0 /100 | #319 | Tragic 14.7% |
| Blacks/African Americans | 0.0 /100 | #320 | Tragic 14.7% |
| Comanche | 0.0 /100 | #321 | Tragic 14.7% |
| Potawatomi | 0.0 /100 | #322 | Tragic 14.8% |
| Apache | 0.0 /100 | #323 | Tragic 14.9% |
| Chippewa | 0.0 /100 | #324 | Tragic 15.0% |
| Arapaho | 0.0 /100 | #325 | Tragic 15.1% |
| Natives/Alaskans | 0.0 /100 | #326 | Tragic 15.3% |
| Pueblo | 0.0 /100 | #327 | Tragic 15.3% |
| Cajuns | 0.0 /100 | #328 | Tragic 15.3% |
| Cherokee | 0.0 /100 | #329 | Tragic 15.5% |
| Navajo | 0.0 /100 | #330 | Tragic 15.5% |
| Dutch West Indians | 0.0 /100 | #331 | Tragic 15.6% |
| Alaskan Athabascans | 0.0 /100 | #332 | Tragic 15.7% |
| Yuman | 0.0 /100 | #333 | Tragic 15.8% |
Demographics Similar to Welsh by Disability Age 35 to 64
In terms of disability age 35 to 64, the demographic groups most similar to Welsh are Mexican (12.4%, a difference of 0.080%), English (12.4%, a difference of 0.12%), Scottish (12.4%, a difference of 0.34%), German Russian (12.5%, a difference of 0.37%), and Japanese (12.3%, a difference of 0.51%).
| Demographics | Rating | Rank | Disability Age 35 to 64 |
| Germans | 1.1 /100 | #251 | Tragic 12.3% |
| Irish | 1.0 /100 | #252 | Tragic 12.3% |
| Dutch | 1.0 /100 | #253 | Tragic 12.3% |
| Hawaiians | 0.9 /100 | #254 | Tragic 12.3% |
| Japanese | 0.8 /100 | #255 | Tragic 12.3% |
| Scottish | 0.8 /100 | #256 | Tragic 12.4% |
| Mexicans | 0.7 /100 | #257 | Tragic 12.4% |
| Welsh | 0.6 /100 | #258 | Tragic 12.4% |
| English | 0.6 /100 | #259 | Tragic 12.4% |
| German Russians | 0.5 /100 | #260 | Tragic 12.5% |
| Malaysians | 0.5 /100 | #261 | Tragic 12.5% |
| Senegalese | 0.5 /100 | #262 | Tragic 12.5% |
| Immigrants | Zaire | 0.4 /100 | #263 | Tragic 12.5% |
| Immigrants | Portugal | 0.4 /100 | #264 | Tragic 12.5% |
| Marshallese | 0.4 /100 | #265 | Tragic 12.5% |