Native/Alaskan vs Liberian Disability Age 35 to 64
COMPARE
Native/Alaskan
Liberian
Disability Age 35 to 64
Disability Age 35 to 64 Comparison
Natives/Alaskans
Liberians
15.3%
DISABILITY AGE 35 TO 64
0.0/ 100
METRIC RATING
326th/ 347
METRIC RANK
12.9%
DISABILITY AGE 35 TO 64
0.1/ 100
METRIC RATING
280th/ 347
METRIC RANK
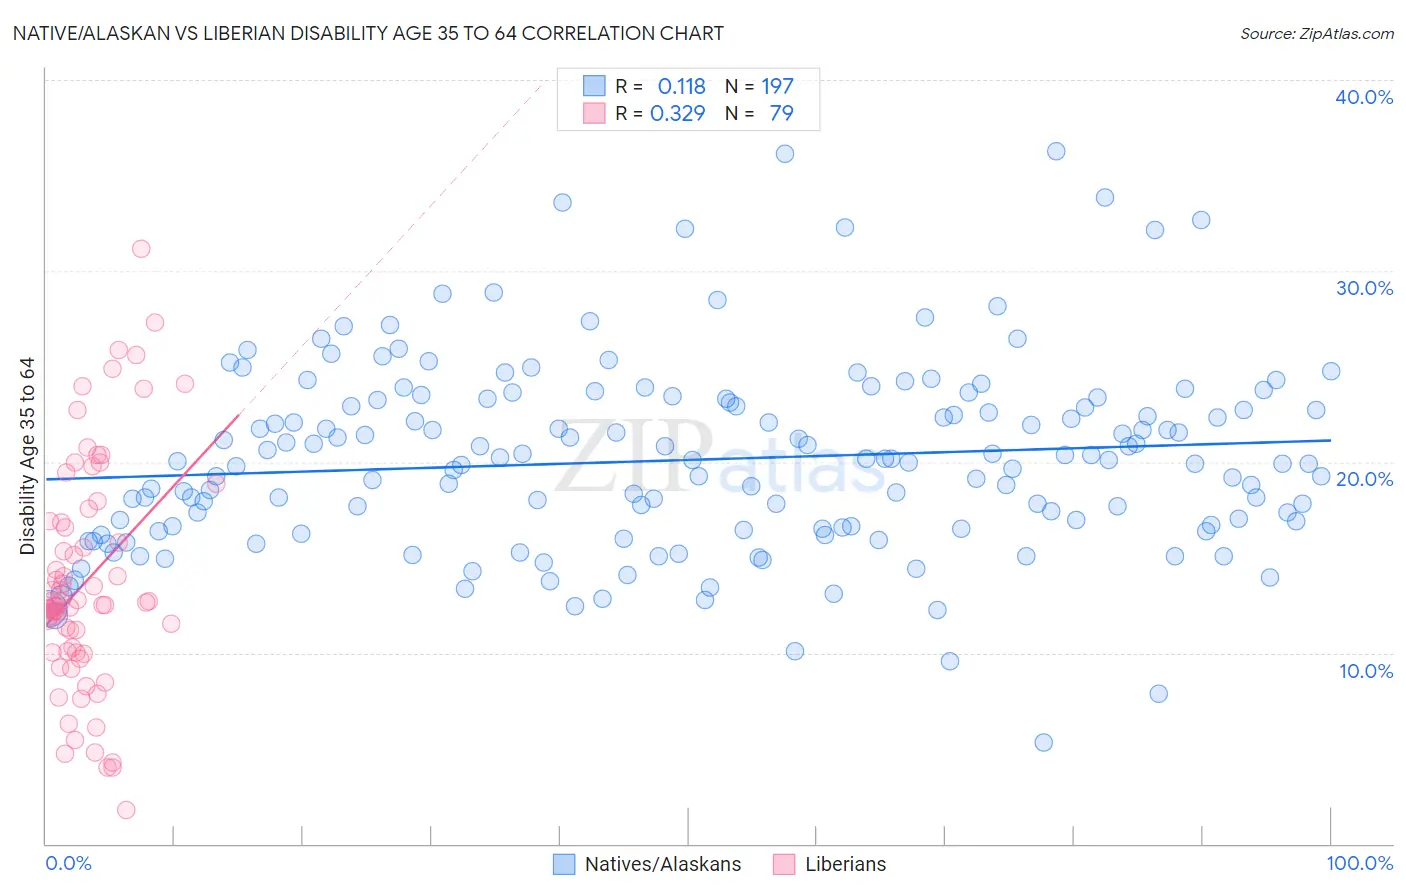
Native/Alaskan vs Liberian Disability Age 35 to 64 Correlation Chart
The statistical analysis conducted on geographies consisting of 512,516,181 people shows a poor positive correlation between the proportion of Natives/Alaskans and percentage of population with a disability between the ages 34 and 64 in the United States with a correlation coefficient (R) of 0.118 and weighted average of 15.3%. Similarly, the statistical analysis conducted on geographies consisting of 118,034,378 people shows a mild positive correlation between the proportion of Liberians and percentage of population with a disability between the ages 34 and 64 in the United States with a correlation coefficient (R) of 0.329 and weighted average of 12.9%, a difference of 18.3%.
Disability Age 35 to 64 Correlation Summary
| Measurement | Native/Alaskan | Liberian |
| Minimum | 5.3% | 1.8% |
| Maximum | 36.2% | 31.1% |
| Range | 31.0% | 29.3% |
| Mean | 20.1% | 13.7% |
| Median | 20.0% | 12.5% |
| Interquartile 25% (IQ1) | 16.5% | 10.0% |
| Interquartile 75% (IQ3) | 23.2% | 16.9% |
| Interquartile Range (IQR) | 6.7% | 6.8% |
| Standard Deviation (Sample) | 5.0% | 6.0% |
| Standard Deviation (Population) | 5.0% | 5.9% |
Similar Demographics by Disability Age 35 to 64
Demographics Similar to Natives/Alaskans by Disability Age 35 to 64
In terms of disability age 35 to 64, the demographic groups most similar to Natives/Alaskans are Pueblo (15.3%, a difference of 0.020%), Cajun (15.3%, a difference of 0.20%), Cherokee (15.5%, a difference of 0.95%), Navajo (15.5%, a difference of 1.2%), and Arapaho (15.1%, a difference of 1.6%).
| Demographics | Rating | Rank | Disability Age 35 to 64 |
| Immigrants | Cabo Verde | 0.0 /100 | #319 | Tragic 14.7% |
| Blacks/African Americans | 0.0 /100 | #320 | Tragic 14.7% |
| Comanche | 0.0 /100 | #321 | Tragic 14.7% |
| Potawatomi | 0.0 /100 | #322 | Tragic 14.8% |
| Apache | 0.0 /100 | #323 | Tragic 14.9% |
| Chippewa | 0.0 /100 | #324 | Tragic 15.0% |
| Arapaho | 0.0 /100 | #325 | Tragic 15.1% |
| Natives/Alaskans | 0.0 /100 | #326 | Tragic 15.3% |
| Pueblo | 0.0 /100 | #327 | Tragic 15.3% |
| Cajuns | 0.0 /100 | #328 | Tragic 15.3% |
| Cherokee | 0.0 /100 | #329 | Tragic 15.5% |
| Navajo | 0.0 /100 | #330 | Tragic 15.5% |
| Dutch West Indians | 0.0 /100 | #331 | Tragic 15.6% |
| Alaskan Athabascans | 0.0 /100 | #332 | Tragic 15.7% |
| Yuman | 0.0 /100 | #333 | Tragic 15.8% |
Demographics Similar to Liberians by Disability Age 35 to 64
In terms of disability age 35 to 64, the demographic groups most similar to Liberians are Immigrants from Micronesia (12.9%, a difference of 0.17%), French Canadian (12.9%, a difference of 0.19%), Scotch-Irish (13.0%, a difference of 0.20%), Immigrants from Dominican Republic (12.9%, a difference of 0.22%), and Immigrants from Laos (13.0%, a difference of 0.29%).
| Demographics | Rating | Rank | Disability Age 35 to 64 |
| Pennsylvania Germans | 0.1 /100 | #273 | Tragic 12.8% |
| Celtics | 0.1 /100 | #274 | Tragic 12.9% |
| Dominicans | 0.1 /100 | #275 | Tragic 12.9% |
| Somalis | 0.1 /100 | #276 | Tragic 12.9% |
| Immigrants | Dominican Republic | 0.1 /100 | #277 | Tragic 12.9% |
| French Canadians | 0.1 /100 | #278 | Tragic 12.9% |
| Immigrants | Micronesia | 0.1 /100 | #279 | Tragic 12.9% |
| Liberians | 0.1 /100 | #280 | Tragic 12.9% |
| Scotch-Irish | 0.1 /100 | #281 | Tragic 13.0% |
| Immigrants | Laos | 0.1 /100 | #282 | Tragic 13.0% |
| Central American Indians | 0.0 /100 | #283 | Tragic 13.0% |
| Immigrants | Nonimmigrants | 0.0 /100 | #284 | Tragic 13.0% |
| Immigrants | Somalia | 0.0 /100 | #285 | Tragic 13.1% |
| Hmong | 0.0 /100 | #286 | Tragic 13.1% |
| Tlingit-Haida | 0.0 /100 | #287 | Tragic 13.2% |