Native/Alaskan vs Bahamian Disability Age 35 to 64
COMPARE
Native/Alaskan
Bahamian
Disability Age 35 to 64
Disability Age 35 to 64 Comparison
Natives/Alaskans
Bahamians
15.3%
DISABILITY AGE 35 TO 64
0.0/ 100
METRIC RATING
326th/ 347
METRIC RANK
11.8%
DISABILITY AGE 35 TO 64
10.7/ 100
METRIC RATING
216th/ 347
METRIC RANK
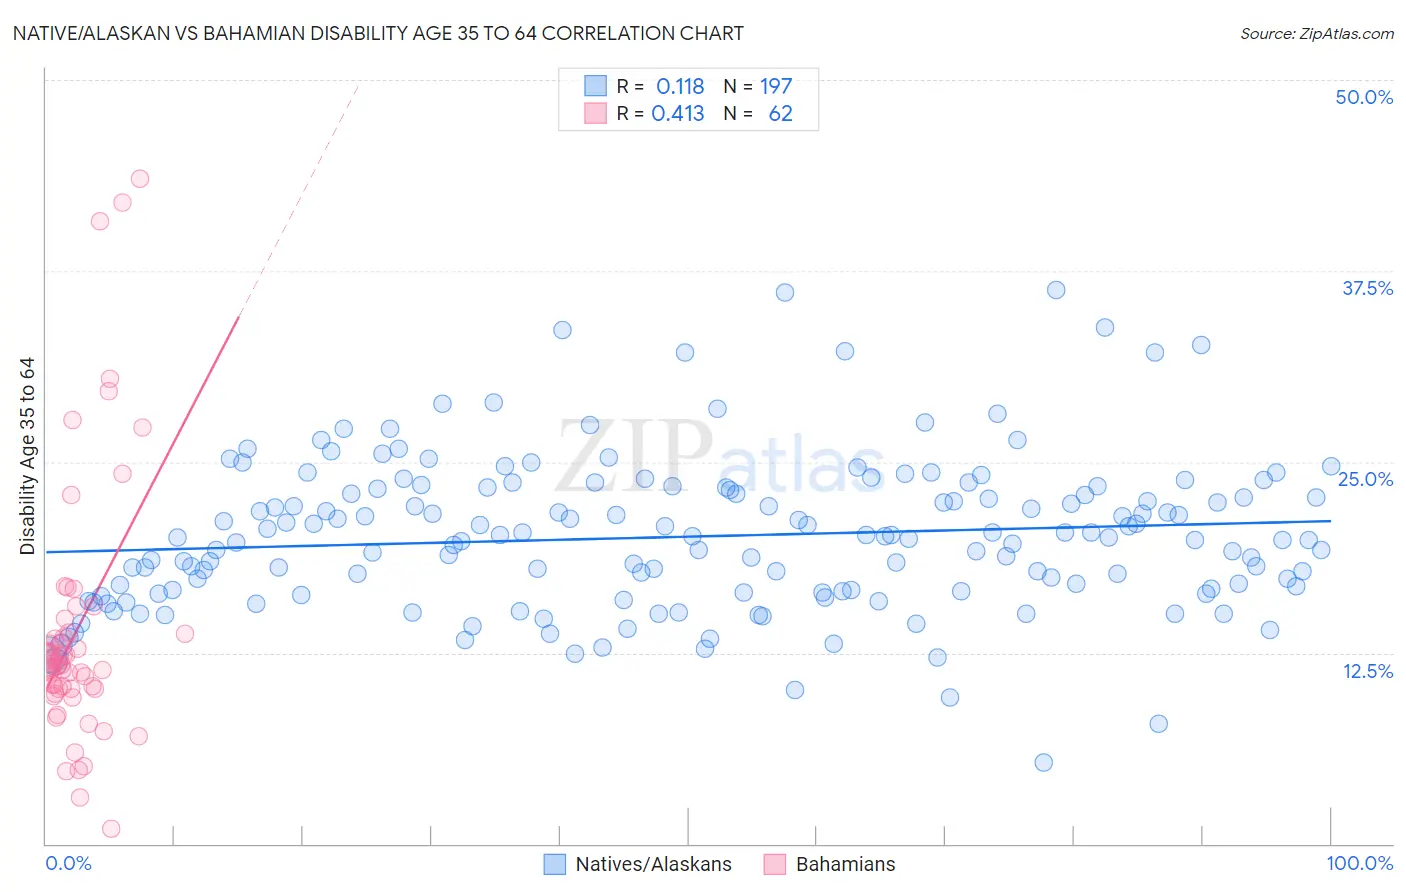
Native/Alaskan vs Bahamian Disability Age 35 to 64 Correlation Chart
The statistical analysis conducted on geographies consisting of 512,516,181 people shows a poor positive correlation between the proportion of Natives/Alaskans and percentage of population with a disability between the ages 34 and 64 in the United States with a correlation coefficient (R) of 0.118 and weighted average of 15.3%. Similarly, the statistical analysis conducted on geographies consisting of 112,619,678 people shows a moderate positive correlation between the proportion of Bahamians and percentage of population with a disability between the ages 34 and 64 in the United States with a correlation coefficient (R) of 0.413 and weighted average of 11.8%, a difference of 30.3%.
Disability Age 35 to 64 Correlation Summary
| Measurement | Native/Alaskan | Bahamian |
| Minimum | 5.3% | 0.98% |
| Maximum | 36.2% | 43.5% |
| Range | 31.0% | 42.6% |
| Mean | 20.1% | 14.0% |
| Median | 20.0% | 11.8% |
| Interquartile 25% (IQ1) | 16.5% | 10.1% |
| Interquartile 75% (IQ3) | 23.2% | 13.8% |
| Interquartile Range (IQR) | 6.7% | 3.7% |
| Standard Deviation (Sample) | 5.0% | 8.6% |
| Standard Deviation (Population) | 5.0% | 8.5% |
Similar Demographics by Disability Age 35 to 64
Demographics Similar to Natives/Alaskans by Disability Age 35 to 64
In terms of disability age 35 to 64, the demographic groups most similar to Natives/Alaskans are Pueblo (15.3%, a difference of 0.020%), Cajun (15.3%, a difference of 0.20%), Cherokee (15.5%, a difference of 0.95%), Navajo (15.5%, a difference of 1.2%), and Arapaho (15.1%, a difference of 1.6%).
| Demographics | Rating | Rank | Disability Age 35 to 64 |
| Immigrants | Cabo Verde | 0.0 /100 | #319 | Tragic 14.7% |
| Blacks/African Americans | 0.0 /100 | #320 | Tragic 14.7% |
| Comanche | 0.0 /100 | #321 | Tragic 14.7% |
| Potawatomi | 0.0 /100 | #322 | Tragic 14.8% |
| Apache | 0.0 /100 | #323 | Tragic 14.9% |
| Chippewa | 0.0 /100 | #324 | Tragic 15.0% |
| Arapaho | 0.0 /100 | #325 | Tragic 15.1% |
| Natives/Alaskans | 0.0 /100 | #326 | Tragic 15.3% |
| Pueblo | 0.0 /100 | #327 | Tragic 15.3% |
| Cajuns | 0.0 /100 | #328 | Tragic 15.3% |
| Cherokee | 0.0 /100 | #329 | Tragic 15.5% |
| Navajo | 0.0 /100 | #330 | Tragic 15.5% |
| Dutch West Indians | 0.0 /100 | #331 | Tragic 15.6% |
| Alaskan Athabascans | 0.0 /100 | #332 | Tragic 15.7% |
| Yuman | 0.0 /100 | #333 | Tragic 15.8% |
Demographics Similar to Bahamians by Disability Age 35 to 64
In terms of disability age 35 to 64, the demographic groups most similar to Bahamians are Spanish American Indian (11.7%, a difference of 0.090%), Immigrants from Sudan (11.7%, a difference of 0.14%), Yugoslavian (11.7%, a difference of 0.18%), Immigrants from Jamaica (11.7%, a difference of 0.21%), and Barbadian (11.8%, a difference of 0.26%).
| Demographics | Rating | Rank | Disability Age 35 to 64 |
| Europeans | 13.5 /100 | #209 | Poor 11.7% |
| Belgians | 13.1 /100 | #210 | Poor 11.7% |
| Canadians | 13.0 /100 | #211 | Poor 11.7% |
| Immigrants | Jamaica | 11.8 /100 | #212 | Poor 11.7% |
| Yugoslavians | 11.6 /100 | #213 | Poor 11.7% |
| Immigrants | Sudan | 11.4 /100 | #214 | Poor 11.7% |
| Spanish American Indians | 11.1 /100 | #215 | Poor 11.7% |
| Bahamians | 10.7 /100 | #216 | Poor 11.8% |
| Barbadians | 9.5 /100 | #217 | Tragic 11.8% |
| Immigrants | Bahamas | 9.2 /100 | #218 | Tragic 11.8% |
| Czechoslovakians | 9.0 /100 | #219 | Tragic 11.8% |
| Immigrants | West Indies | 8.9 /100 | #220 | Tragic 11.8% |
| Alsatians | 8.5 /100 | #221 | Tragic 11.8% |
| Hondurans | 8.4 /100 | #222 | Tragic 11.8% |
| Immigrants | Honduras | 8.4 /100 | #223 | Tragic 11.8% |