Immigrants from Africa vs South African Disability Age 35 to 64
COMPARE
Immigrants from Africa
South African
Disability Age 35 to 64
Disability Age 35 to 64 Comparison
Immigrants from Africa
South Africans
11.5%
DISABILITY AGE 35 TO 64
29.0/ 100
METRIC RATING
193rd/ 347
METRIC RANK
10.7%
DISABILITY AGE 35 TO 64
93.3/ 100
METRIC RATING
128th/ 347
METRIC RANK
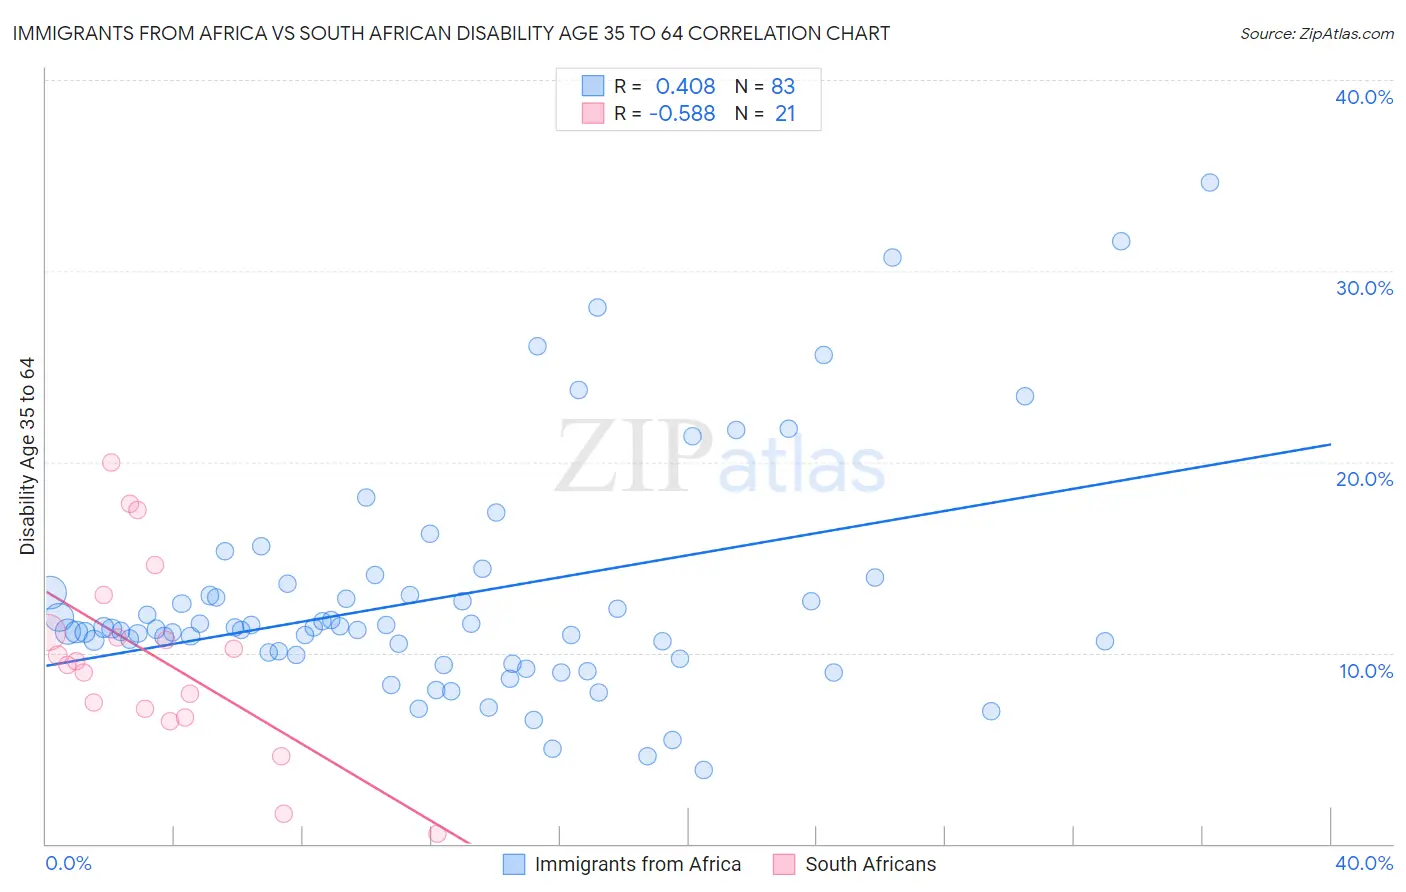
Immigrants from Africa vs South African Disability Age 35 to 64 Correlation Chart
The statistical analysis conducted on geographies consisting of 468,853,618 people shows a moderate positive correlation between the proportion of Immigrants from Africa and percentage of population with a disability between the ages 34 and 64 in the United States with a correlation coefficient (R) of 0.408 and weighted average of 11.5%. Similarly, the statistical analysis conducted on geographies consisting of 182,548,455 people shows a substantial negative correlation between the proportion of South Africans and percentage of population with a disability between the ages 34 and 64 in the United States with a correlation coefficient (R) of -0.588 and weighted average of 10.7%, a difference of 7.5%.
Disability Age 35 to 64 Correlation Summary
| Measurement | Immigrants from Africa | South African |
| Minimum | 3.9% | 0.50% |
| Maximum | 34.6% | 19.9% |
| Range | 30.8% | 19.4% |
| Mean | 12.9% | 9.8% |
| Median | 11.2% | 9.5% |
| Interquartile 25% (IQ1) | 9.9% | 6.8% |
| Interquartile 75% (IQ3) | 13.1% | 12.0% |
| Interquartile Range (IQR) | 3.3% | 5.2% |
| Standard Deviation (Sample) | 6.0% | 4.9% |
| Standard Deviation (Population) | 6.0% | 4.8% |
Similar Demographics by Disability Age 35 to 64
Demographics Similar to Immigrants from Africa by Disability Age 35 to 64
In terms of disability age 35 to 64, the demographic groups most similar to Immigrants from Africa are Norwegian (11.5%, a difference of 0.060%), Immigrants from Latin America (11.5%, a difference of 0.15%), Swedish (11.4%, a difference of 0.22%), Immigrants from Nigeria (11.4%, a difference of 0.32%), and Carpatho Rusyn (11.5%, a difference of 0.37%).
| Demographics | Rating | Rank | Disability Age 35 to 64 |
| Slovenes | 36.6 /100 | #186 | Fair 11.4% |
| Immigrants | Bosnia and Herzegovina | 35.2 /100 | #187 | Fair 11.4% |
| Northern Europeans | 34.9 /100 | #188 | Fair 11.4% |
| Hungarians | 34.6 /100 | #189 | Fair 11.4% |
| Immigrants | Nigeria | 32.5 /100 | #190 | Fair 11.4% |
| Swedes | 31.3 /100 | #191 | Fair 11.4% |
| Norwegians | 29.7 /100 | #192 | Fair 11.5% |
| Immigrants | Africa | 29.0 /100 | #193 | Fair 11.5% |
| Immigrants | Latin America | 27.5 /100 | #194 | Fair 11.5% |
| Carpatho Rusyns | 25.3 /100 | #195 | Fair 11.5% |
| Iraqis | 24.2 /100 | #196 | Fair 11.5% |
| Immigrants | Iraq | 21.0 /100 | #197 | Fair 11.6% |
| Immigrants | Panama | 20.4 /100 | #198 | Fair 11.6% |
| Basques | 19.5 /100 | #199 | Poor 11.6% |
| Swiss | 18.7 /100 | #200 | Poor 11.6% |
Demographics Similar to South Africans by Disability Age 35 to 64
In terms of disability age 35 to 64, the demographic groups most similar to South Africans are Ecuadorian (10.7%, a difference of 0.080%), Immigrants from Syria (10.7%, a difference of 0.11%), Immigrants from El Salvador (10.7%, a difference of 0.16%), Immigrants from Zimbabwe (10.6%, a difference of 0.23%), and Immigrants from Albania (10.7%, a difference of 0.27%).
| Demographics | Rating | Rank | Disability Age 35 to 64 |
| Romanians | 95.0 /100 | #121 | Exceptional 10.6% |
| Immigrants | Norway | 95.0 /100 | #122 | Exceptional 10.6% |
| Maltese | 94.8 /100 | #123 | Exceptional 10.6% |
| Estonians | 94.5 /100 | #124 | Exceptional 10.6% |
| Albanians | 94.2 /100 | #125 | Exceptional 10.6% |
| Immigrants | Afghanistan | 94.1 /100 | #126 | Exceptional 10.6% |
| Immigrants | Zimbabwe | 94.0 /100 | #127 | Exceptional 10.6% |
| South Africans | 93.3 /100 | #128 | Exceptional 10.7% |
| Ecuadorians | 93.1 /100 | #129 | Exceptional 10.7% |
| Immigrants | Syria | 93.0 /100 | #130 | Exceptional 10.7% |
| Immigrants | El Salvador | 92.8 /100 | #131 | Exceptional 10.7% |
| Immigrants | Albania | 92.5 /100 | #132 | Exceptional 10.7% |
| Immigrants | Immigrants | 92.5 /100 | #133 | Exceptional 10.7% |
| Immigrants | Ecuador | 92.5 /100 | #134 | Exceptional 10.7% |
| Greeks | 92.3 /100 | #135 | Exceptional 10.7% |