Native/Alaskan vs Korean Disability Age 35 to 64
COMPARE
Native/Alaskan
Korean
Disability Age 35 to 64
Disability Age 35 to 64 Comparison
Natives/Alaskans
Koreans
15.3%
DISABILITY AGE 35 TO 64
0.0/ 100
METRIC RATING
326th/ 347
METRIC RANK
10.5%
DISABILITY AGE 35 TO 64
97.1/ 100
METRIC RATING
110th/ 347
METRIC RANK
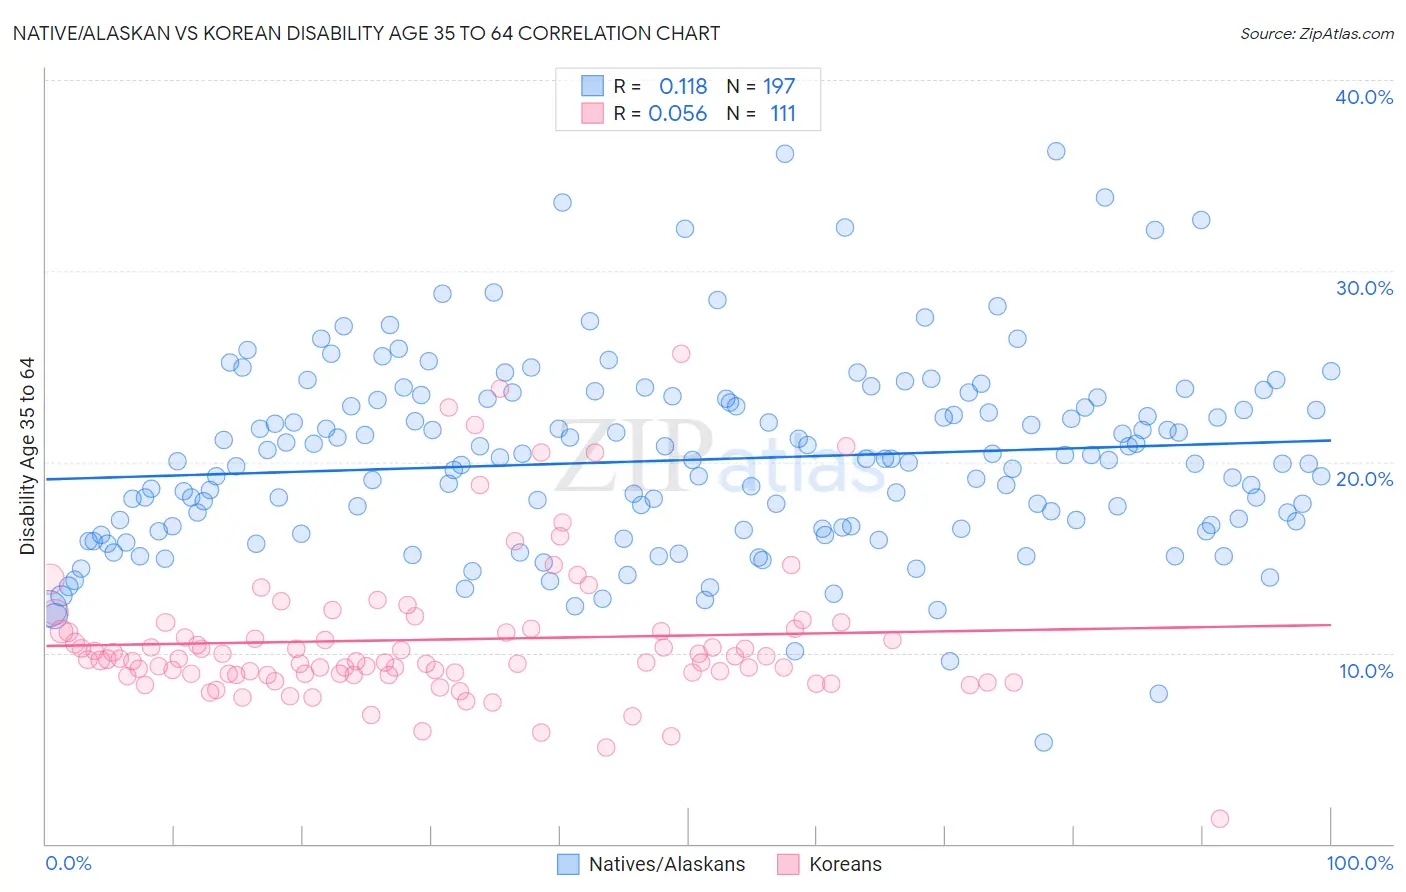
Native/Alaskan vs Korean Disability Age 35 to 64 Correlation Chart
The statistical analysis conducted on geographies consisting of 512,516,181 people shows a poor positive correlation between the proportion of Natives/Alaskans and percentage of population with a disability between the ages 34 and 64 in the United States with a correlation coefficient (R) of 0.118 and weighted average of 15.3%. Similarly, the statistical analysis conducted on geographies consisting of 510,268,552 people shows a slight positive correlation between the proportion of Koreans and percentage of population with a disability between the ages 34 and 64 in the United States with a correlation coefficient (R) of 0.056 and weighted average of 10.5%, a difference of 46.2%.
Disability Age 35 to 64 Correlation Summary
| Measurement | Native/Alaskan | Korean |
| Minimum | 5.3% | 1.3% |
| Maximum | 36.2% | 25.7% |
| Range | 31.0% | 24.4% |
| Mean | 20.1% | 10.7% |
| Median | 20.0% | 9.6% |
| Interquartile 25% (IQ1) | 16.5% | 8.9% |
| Interquartile 75% (IQ3) | 23.2% | 11.2% |
| Interquartile Range (IQR) | 6.7% | 2.4% |
| Standard Deviation (Sample) | 5.0% | 3.9% |
| Standard Deviation (Population) | 5.0% | 3.8% |
Similar Demographics by Disability Age 35 to 64
Demographics Similar to Natives/Alaskans by Disability Age 35 to 64
In terms of disability age 35 to 64, the demographic groups most similar to Natives/Alaskans are Pueblo (15.3%, a difference of 0.020%), Cajun (15.3%, a difference of 0.20%), Cherokee (15.5%, a difference of 0.95%), Navajo (15.5%, a difference of 1.2%), and Arapaho (15.1%, a difference of 1.6%).
| Demographics | Rating | Rank | Disability Age 35 to 64 |
| Immigrants | Cabo Verde | 0.0 /100 | #319 | Tragic 14.7% |
| Blacks/African Americans | 0.0 /100 | #320 | Tragic 14.7% |
| Comanche | 0.0 /100 | #321 | Tragic 14.7% |
| Potawatomi | 0.0 /100 | #322 | Tragic 14.8% |
| Apache | 0.0 /100 | #323 | Tragic 14.9% |
| Chippewa | 0.0 /100 | #324 | Tragic 15.0% |
| Arapaho | 0.0 /100 | #325 | Tragic 15.1% |
| Natives/Alaskans | 0.0 /100 | #326 | Tragic 15.3% |
| Pueblo | 0.0 /100 | #327 | Tragic 15.3% |
| Cajuns | 0.0 /100 | #328 | Tragic 15.3% |
| Cherokee | 0.0 /100 | #329 | Tragic 15.5% |
| Navajo | 0.0 /100 | #330 | Tragic 15.5% |
| Dutch West Indians | 0.0 /100 | #331 | Tragic 15.6% |
| Alaskan Athabascans | 0.0 /100 | #332 | Tragic 15.7% |
| Yuman | 0.0 /100 | #333 | Tragic 15.8% |
Demographics Similar to Koreans by Disability Age 35 to 64
In terms of disability age 35 to 64, the demographic groups most similar to Koreans are Immigrants from Ethiopia (10.5%, a difference of 0.060%), Ethiopian (10.5%, a difference of 0.20%), Brazilian (10.5%, a difference of 0.20%), Zimbabwean (10.4%, a difference of 0.22%), and Assyrian/Chaldean/Syriac (10.5%, a difference of 0.24%).
| Demographics | Rating | Rank | Disability Age 35 to 64 |
| Immigrants | Ukraine | 97.9 /100 | #103 | Exceptional 10.4% |
| Immigrants | Austria | 97.8 /100 | #104 | Exceptional 10.4% |
| Macedonians | 97.8 /100 | #105 | Exceptional 10.4% |
| Immigrants | Hungary | 97.6 /100 | #106 | Exceptional 10.4% |
| Zimbabweans | 97.4 /100 | #107 | Exceptional 10.4% |
| Ethiopians | 97.4 /100 | #108 | Exceptional 10.5% |
| Immigrants | Ethiopia | 97.2 /100 | #109 | Exceptional 10.5% |
| Koreans | 97.1 /100 | #110 | Exceptional 10.5% |
| Brazilians | 96.9 /100 | #111 | Exceptional 10.5% |
| Assyrians/Chaldeans/Syriacs | 96.8 /100 | #112 | Exceptional 10.5% |
| Tongans | 96.6 /100 | #113 | Exceptional 10.5% |
| Immigrants | Morocco | 96.6 /100 | #114 | Exceptional 10.5% |
| Immigrants | Netherlands | 96.3 /100 | #115 | Exceptional 10.5% |
| Immigrants | Nepal | 95.9 /100 | #116 | Exceptional 10.6% |
| Immigrants | South Eastern Asia | 95.7 /100 | #117 | Exceptional 10.6% |