Ugandan vs Peruvian Disability Age Over 75
COMPARE
Ugandan
Peruvian
Disability Age Over 75
Disability Age Over 75 Comparison
Ugandans
Peruvians
46.3%
DISABILITY AGE OVER 75
98.2/ 100
METRIC RATING
93rd/ 347
METRIC RANK
46.8%
DISABILITY AGE OVER 75
86.5/ 100
METRIC RATING
142nd/ 347
METRIC RANK
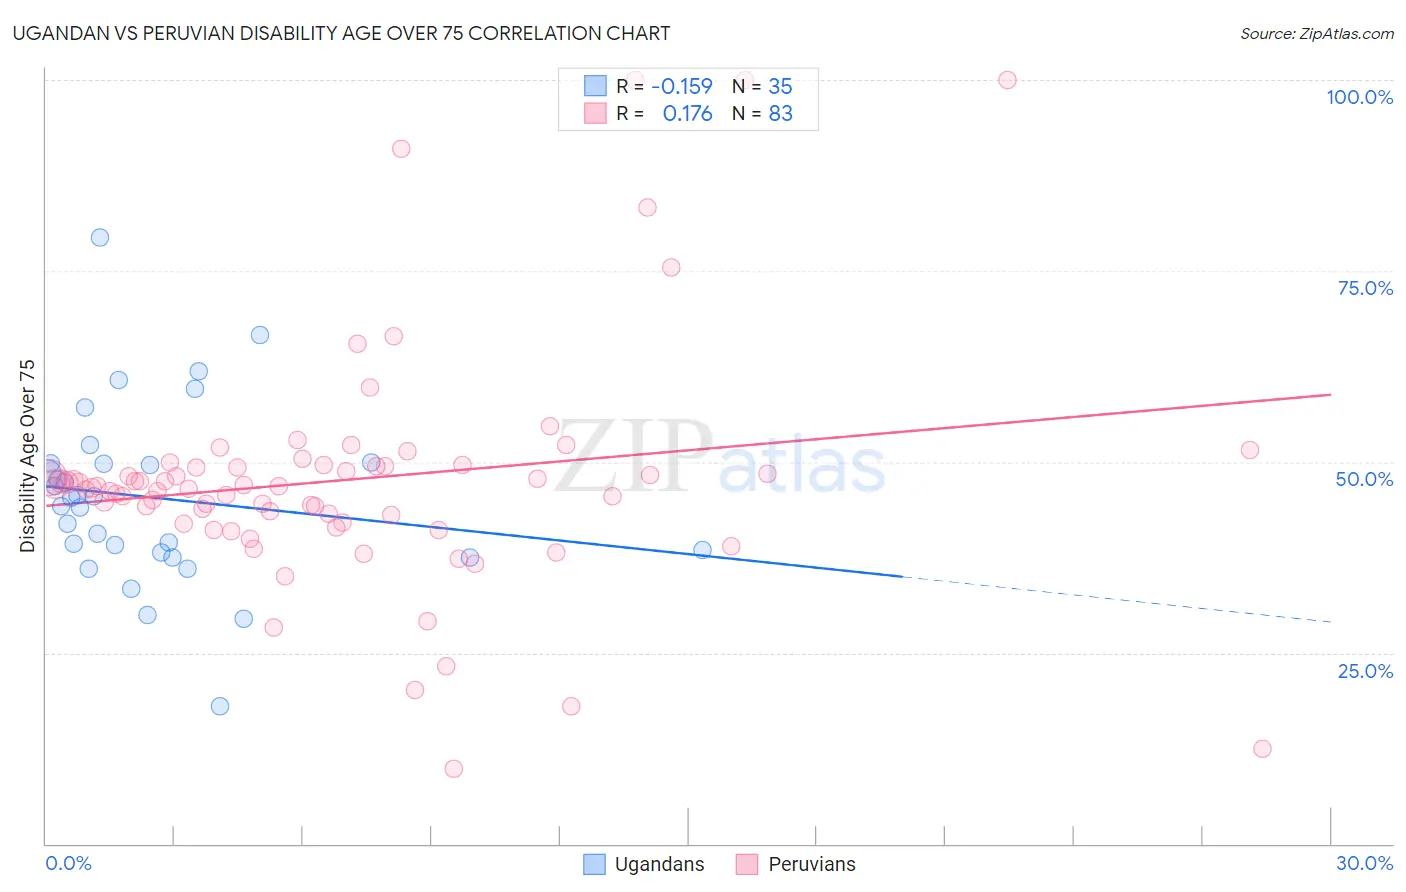
Ugandan vs Peruvian Disability Age Over 75 Correlation Chart
The statistical analysis conducted on geographies consisting of 93,983,059 people shows a poor negative correlation between the proportion of Ugandans and percentage of population with a disability over the age of 75 in the United States with a correlation coefficient (R) of -0.159 and weighted average of 46.3%. Similarly, the statistical analysis conducted on geographies consisting of 362,503,008 people shows a poor positive correlation between the proportion of Peruvians and percentage of population with a disability over the age of 75 in the United States with a correlation coefficient (R) of 0.176 and weighted average of 46.8%, a difference of 1.2%.
Disability Age Over 75 Correlation Summary
| Measurement | Ugandan | Peruvian |
| Minimum | 17.9% | 9.9% |
| Maximum | 79.3% | 100.0% |
| Range | 61.4% | 90.1% |
| Mean | 45.3% | 47.6% |
| Median | 45.3% | 46.8% |
| Interquartile 25% (IQ1) | 38.1% | 42.1% |
| Interquartile 75% (IQ3) | 49.8% | 49.4% |
| Interquartile Range (IQR) | 11.7% | 7.3% |
| Standard Deviation (Sample) | 11.6% | 15.6% |
| Standard Deviation (Population) | 11.4% | 15.5% |
Similar Demographics by Disability Age Over 75
Demographics Similar to Ugandans by Disability Age Over 75
In terms of disability age over 75, the demographic groups most similar to Ugandans are German (46.3%, a difference of 0.0%), Albanian (46.3%, a difference of 0.030%), Immigrants from Egypt (46.3%, a difference of 0.050%), Northern European (46.3%, a difference of 0.060%), and Immigrants from Brazil (46.3%, a difference of 0.060%).
| Demographics | Rating | Rank | Disability Age Over 75 |
| Romanians | 98.6 /100 | #86 | Exceptional 46.2% |
| Danes | 98.6 /100 | #87 | Exceptional 46.2% |
| Uruguayans | 98.4 /100 | #88 | Exceptional 46.2% |
| Immigrants | Saudi Arabia | 98.4 /100 | #89 | Exceptional 46.3% |
| Northern Europeans | 98.3 /100 | #90 | Exceptional 46.3% |
| Immigrants | Egypt | 98.3 /100 | #91 | Exceptional 46.3% |
| Germans | 98.2 /100 | #92 | Exceptional 46.3% |
| Ugandans | 98.2 /100 | #93 | Exceptional 46.3% |
| Albanians | 98.1 /100 | #94 | Exceptional 46.3% |
| Immigrants | Brazil | 98.0 /100 | #95 | Exceptional 46.3% |
| Immigrants | China | 98.0 /100 | #96 | Exceptional 46.3% |
| Finns | 97.9 /100 | #97 | Exceptional 46.3% |
| Immigrants | Japan | 97.8 /100 | #98 | Exceptional 46.3% |
| Palestinians | 97.7 /100 | #99 | Exceptional 46.3% |
| Immigrants | Eastern Europe | 97.7 /100 | #100 | Exceptional 46.3% |
Demographics Similar to Peruvians by Disability Age Over 75
In terms of disability age over 75, the demographic groups most similar to Peruvians are Lebanese (46.8%, a difference of 0.020%), Bermudan (46.9%, a difference of 0.040%), Immigrants from Costa Rica (46.8%, a difference of 0.050%), Venezuelan (46.9%, a difference of 0.070%), and Costa Rican (46.9%, a difference of 0.090%).
| Demographics | Rating | Rank | Disability Age Over 75 |
| Ethiopians | 88.9 /100 | #135 | Excellent 46.8% |
| Immigrants | Venezuela | 88.6 /100 | #136 | Excellent 46.8% |
| Immigrants | Uganda | 88.5 /100 | #137 | Excellent 46.8% |
| Immigrants | Bosnia and Herzegovina | 88.5 /100 | #138 | Excellent 46.8% |
| Yugoslavians | 88.5 /100 | #139 | Excellent 46.8% |
| Immigrants | Costa Rica | 87.4 /100 | #140 | Excellent 46.8% |
| Lebanese | 87.0 /100 | #141 | Excellent 46.8% |
| Peruvians | 86.5 /100 | #142 | Excellent 46.8% |
| Bermudans | 85.6 /100 | #143 | Excellent 46.9% |
| Venezuelans | 85.0 /100 | #144 | Excellent 46.9% |
| Costa Ricans | 84.5 /100 | #145 | Excellent 46.9% |
| Guyanese | 84.3 /100 | #146 | Excellent 46.9% |
| Immigrants | Peru | 84.1 /100 | #147 | Excellent 46.9% |
| Asians | 81.6 /100 | #148 | Excellent 46.9% |
| Welsh | 81.3 /100 | #149 | Excellent 47.0% |