Assyrian/Chaldean/Syriac vs Peruvian Disability Age Over 75
COMPARE
Assyrian/Chaldean/Syriac
Peruvian
Disability Age Over 75
Disability Age Over 75 Comparison
Assyrians/Chaldeans/Syriacs
Peruvians
49.1%
DISABILITY AGE OVER 75
0.2/ 100
METRIC RATING
272nd/ 347
METRIC RANK
46.8%
DISABILITY AGE OVER 75
86.5/ 100
METRIC RATING
142nd/ 347
METRIC RANK
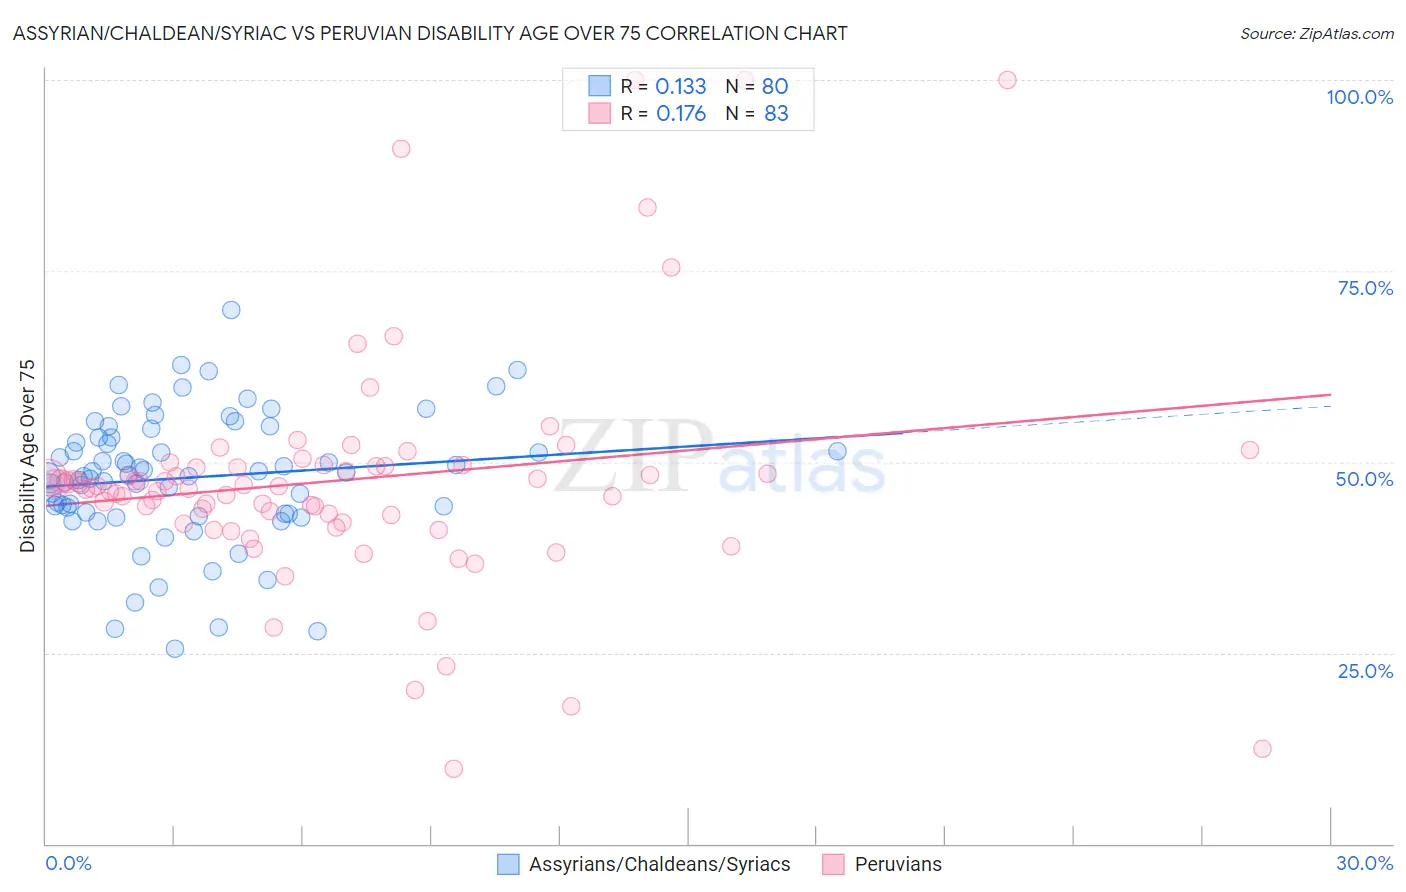
Assyrian/Chaldean/Syriac vs Peruvian Disability Age Over 75 Correlation Chart
The statistical analysis conducted on geographies consisting of 110,272,420 people shows a poor positive correlation between the proportion of Assyrians/Chaldeans/Syriacs and percentage of population with a disability over the age of 75 in the United States with a correlation coefficient (R) of 0.133 and weighted average of 49.1%. Similarly, the statistical analysis conducted on geographies consisting of 362,503,008 people shows a poor positive correlation between the proportion of Peruvians and percentage of population with a disability over the age of 75 in the United States with a correlation coefficient (R) of 0.176 and weighted average of 46.8%, a difference of 4.7%.
Disability Age Over 75 Correlation Summary
| Measurement | Assyrian/Chaldean/Syriac | Peruvian |
| Minimum | 25.6% | 9.9% |
| Maximum | 69.9% | 100.0% |
| Range | 44.3% | 90.1% |
| Mean | 47.9% | 47.6% |
| Median | 48.2% | 46.8% |
| Interquartile 25% (IQ1) | 43.3% | 42.1% |
| Interquartile 75% (IQ3) | 53.1% | 49.4% |
| Interquartile Range (IQR) | 9.9% | 7.3% |
| Standard Deviation (Sample) | 8.5% | 15.6% |
| Standard Deviation (Population) | 8.4% | 15.5% |
Similar Demographics by Disability Age Over 75
Demographics Similar to Assyrians/Chaldeans/Syriacs by Disability Age Over 75
In terms of disability age over 75, the demographic groups most similar to Assyrians/Chaldeans/Syriacs are Fijian (49.0%, a difference of 0.010%), Potawatomi (49.0%, a difference of 0.030%), Immigrants from Iraq (49.1%, a difference of 0.050%), Immigrants from El Salvador (49.0%, a difference of 0.060%), and Guatemalan (49.0%, a difference of 0.080%).
| Demographics | Rating | Rank | Disability Age Over 75 |
| Hondurans | 0.3 /100 | #265 | Tragic 48.9% |
| U.S. Virgin Islanders | 0.2 /100 | #266 | Tragic 48.9% |
| Malaysians | 0.2 /100 | #267 | Tragic 49.0% |
| Guatemalans | 0.2 /100 | #268 | Tragic 49.0% |
| Immigrants | El Salvador | 0.2 /100 | #269 | Tragic 49.0% |
| Potawatomi | 0.2 /100 | #270 | Tragic 49.0% |
| Fijians | 0.2 /100 | #271 | Tragic 49.0% |
| Assyrians/Chaldeans/Syriacs | 0.2 /100 | #272 | Tragic 49.1% |
| Immigrants | Iraq | 0.1 /100 | #273 | Tragic 49.1% |
| Immigrants | Guatemala | 0.1 /100 | #274 | Tragic 49.1% |
| Immigrants | Dominica | 0.1 /100 | #275 | Tragic 49.1% |
| Immigrants | Uzbekistan | 0.1 /100 | #276 | Tragic 49.2% |
| Hawaiians | 0.1 /100 | #277 | Tragic 49.2% |
| Immigrants | Laos | 0.1 /100 | #278 | Tragic 49.2% |
| Guamanians/Chamorros | 0.0 /100 | #279 | Tragic 49.4% |
Demographics Similar to Peruvians by Disability Age Over 75
In terms of disability age over 75, the demographic groups most similar to Peruvians are Lebanese (46.8%, a difference of 0.020%), Bermudan (46.9%, a difference of 0.040%), Immigrants from Costa Rica (46.8%, a difference of 0.050%), Venezuelan (46.9%, a difference of 0.070%), and Costa Rican (46.9%, a difference of 0.090%).
| Demographics | Rating | Rank | Disability Age Over 75 |
| Ethiopians | 88.9 /100 | #135 | Excellent 46.8% |
| Immigrants | Venezuela | 88.6 /100 | #136 | Excellent 46.8% |
| Immigrants | Uganda | 88.5 /100 | #137 | Excellent 46.8% |
| Immigrants | Bosnia and Herzegovina | 88.5 /100 | #138 | Excellent 46.8% |
| Yugoslavians | 88.5 /100 | #139 | Excellent 46.8% |
| Immigrants | Costa Rica | 87.4 /100 | #140 | Excellent 46.8% |
| Lebanese | 87.0 /100 | #141 | Excellent 46.8% |
| Peruvians | 86.5 /100 | #142 | Excellent 46.8% |
| Bermudans | 85.6 /100 | #143 | Excellent 46.9% |
| Venezuelans | 85.0 /100 | #144 | Excellent 46.9% |
| Costa Ricans | 84.5 /100 | #145 | Excellent 46.9% |
| Guyanese | 84.3 /100 | #146 | Excellent 46.9% |
| Immigrants | Peru | 84.1 /100 | #147 | Excellent 46.9% |
| Asians | 81.6 /100 | #148 | Excellent 46.9% |
| Welsh | 81.3 /100 | #149 | Excellent 47.0% |