Native/Alaskan vs Peruvian Unemployment Among Seniors over 65 years
COMPARE
Native/Alaskan
Peruvian
Unemployment Among Seniors over 65 years
Unemployment Among Seniors over 65 years Comparison
Natives/Alaskans
Peruvians
5.8%
UNEMPLOYMENT AMONG SENIORS OVER 65 YEARS
0.0/ 100
METRIC RATING
322nd/ 347
METRIC RANK
5.3%
UNEMPLOYMENT AMONG SENIORS OVER 65 YEARS
0.8/ 100
METRIC RATING
244th/ 347
METRIC RANK
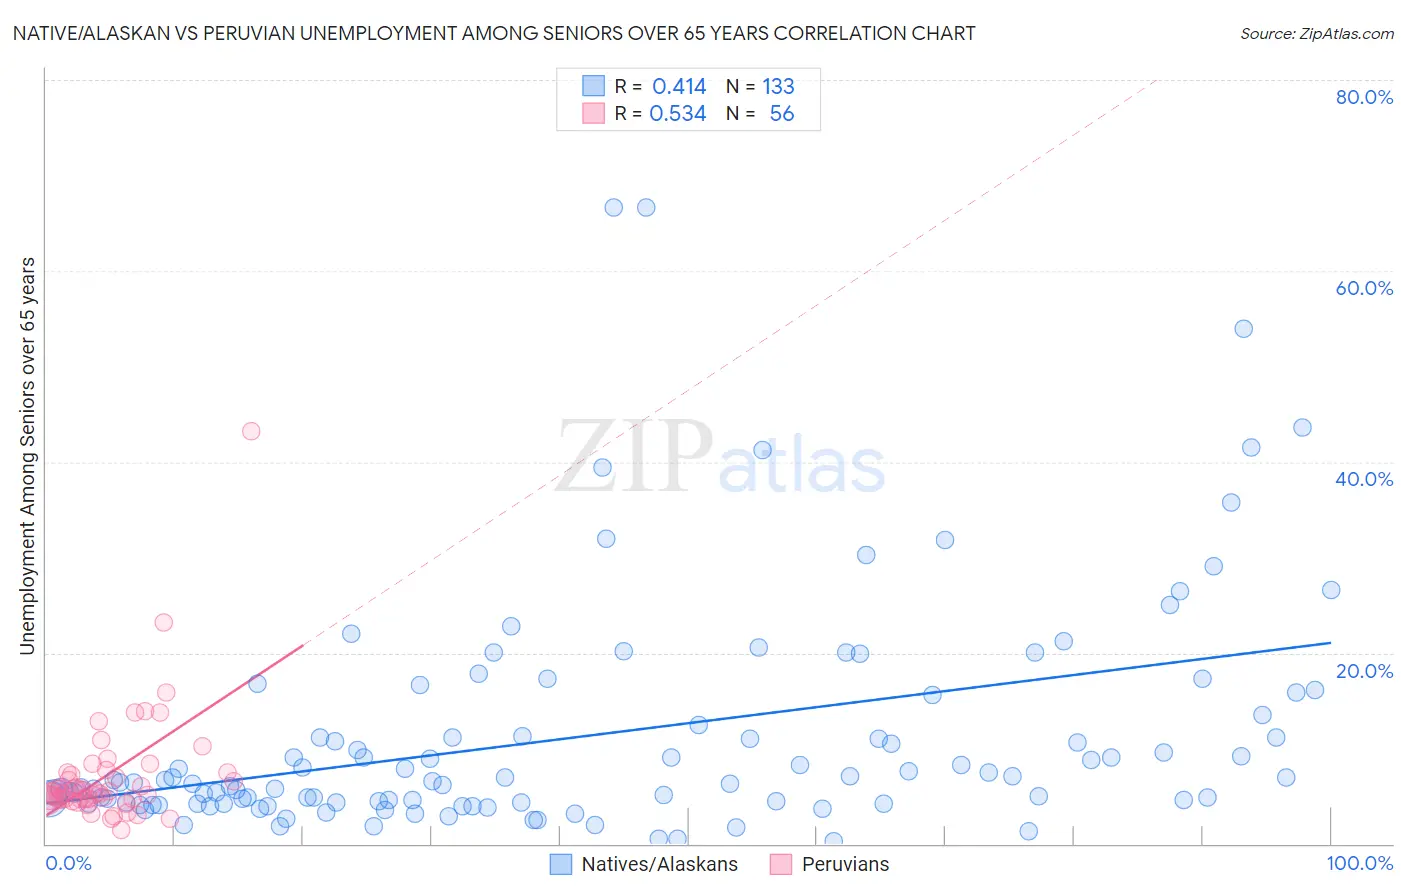
Native/Alaskan vs Peruvian Unemployment Among Seniors over 65 years Correlation Chart
The statistical analysis conducted on geographies consisting of 433,164,375 people shows a moderate positive correlation between the proportion of Natives/Alaskans and unemployment rate amomg seniors over the age of 65 in the United States with a correlation coefficient (R) of 0.414 and weighted average of 5.8%. Similarly, the statistical analysis conducted on geographies consisting of 333,726,313 people shows a substantial positive correlation between the proportion of Peruvians and unemployment rate amomg seniors over the age of 65 in the United States with a correlation coefficient (R) of 0.534 and weighted average of 5.3%, a difference of 7.9%.
Unemployment Among Seniors over 65 years Correlation Summary
| Measurement | Native/Alaskan | Peruvian |
| Minimum | 0.30% | 1.4% |
| Maximum | 66.6% | 43.2% |
| Range | 66.3% | 41.8% |
| Mean | 11.3% | 7.2% |
| Median | 6.5% | 5.4% |
| Interquartile 25% (IQ1) | 4.3% | 4.7% |
| Interquartile 75% (IQ3) | 12.9% | 7.5% |
| Interquartile Range (IQR) | 8.7% | 2.8% |
| Standard Deviation (Sample) | 12.1% | 6.2% |
| Standard Deviation (Population) | 12.0% | 6.1% |
Similar Demographics by Unemployment Among Seniors over 65 years
Demographics Similar to Natives/Alaskans by Unemployment Among Seniors over 65 years
In terms of unemployment among seniors over 65 years, the demographic groups most similar to Natives/Alaskans are British West Indian (5.8%, a difference of 0.080%), Immigrants from Dominica (5.8%, a difference of 0.34%), Yuman (5.8%, a difference of 0.51%), Immigrants from Mexico (5.7%, a difference of 0.72%), and Immigrants from Bangladesh (5.7%, a difference of 0.88%).
| Demographics | Rating | Rank | Unemployment Among Seniors over 65 years |
| Immigrants | El Salvador | 0.0 /100 | #315 | Tragic 5.7% |
| Immigrants | Central America | 0.0 /100 | #316 | Tragic 5.7% |
| Immigrants | Bahamas | 0.0 /100 | #317 | Tragic 5.7% |
| Vietnamese | 0.0 /100 | #318 | Tragic 5.7% |
| Immigrants | Bangladesh | 0.0 /100 | #319 | Tragic 5.7% |
| Immigrants | Mexico | 0.0 /100 | #320 | Tragic 5.7% |
| British West Indians | 0.0 /100 | #321 | Tragic 5.8% |
| Natives/Alaskans | 0.0 /100 | #322 | Tragic 5.8% |
| Immigrants | Dominica | 0.0 /100 | #323 | Tragic 5.8% |
| Yuman | 0.0 /100 | #324 | Tragic 5.8% |
| Inupiat | 0.0 /100 | #325 | Tragic 5.8% |
| Shoshone | 0.0 /100 | #326 | Tragic 5.9% |
| Bermudans | 0.0 /100 | #327 | Tragic 5.9% |
| Puerto Ricans | 0.0 /100 | #328 | Tragic 5.9% |
| Dominicans | 0.0 /100 | #329 | Tragic 6.0% |
Demographics Similar to Peruvians by Unemployment Among Seniors over 65 years
In terms of unemployment among seniors over 65 years, the demographic groups most similar to Peruvians are Ottawa (5.3%, a difference of 0.010%), Colombian (5.3%, a difference of 0.040%), Immigrants from Caribbean (5.3%, a difference of 0.080%), Nigerian (5.3%, a difference of 0.10%), and Bahamian (5.3%, a difference of 0.13%).
| Demographics | Rating | Rank | Unemployment Among Seniors over 65 years |
| Immigrants | Greece | 2.0 /100 | #237 | Tragic 5.3% |
| Immigrants | Israel | 2.0 /100 | #238 | Tragic 5.3% |
| Immigrants | Senegal | 1.8 /100 | #239 | Tragic 5.3% |
| Immigrants | Trinidad and Tobago | 1.6 /100 | #240 | Tragic 5.3% |
| Apache | 1.3 /100 | #241 | Tragic 5.3% |
| Bahamians | 0.9 /100 | #242 | Tragic 5.3% |
| Nigerians | 0.9 /100 | #243 | Tragic 5.3% |
| Peruvians | 0.8 /100 | #244 | Tragic 5.3% |
| Ottawa | 0.8 /100 | #245 | Tragic 5.3% |
| Colombians | 0.7 /100 | #246 | Tragic 5.3% |
| Immigrants | Caribbean | 0.7 /100 | #247 | Tragic 5.3% |
| French Canadians | 0.7 /100 | #248 | Tragic 5.4% |
| Immigrants | Immigrants | 0.6 /100 | #249 | Tragic 5.4% |
| Ghanaians | 0.6 /100 | #250 | Tragic 5.4% |
| West Indians | 0.6 /100 | #251 | Tragic 5.4% |