Native/Alaskan vs Peruvian Disability
COMPARE
Native/Alaskan
Peruvian
Disability
Disability Comparison
Natives/Alaskans
Peruvians
14.2%
DISABILITY
0.0/ 100
METRIC RATING
325th/ 347
METRIC RANK
10.9%
DISABILITY
99.8/ 100
METRIC RATING
51st/ 347
METRIC RANK
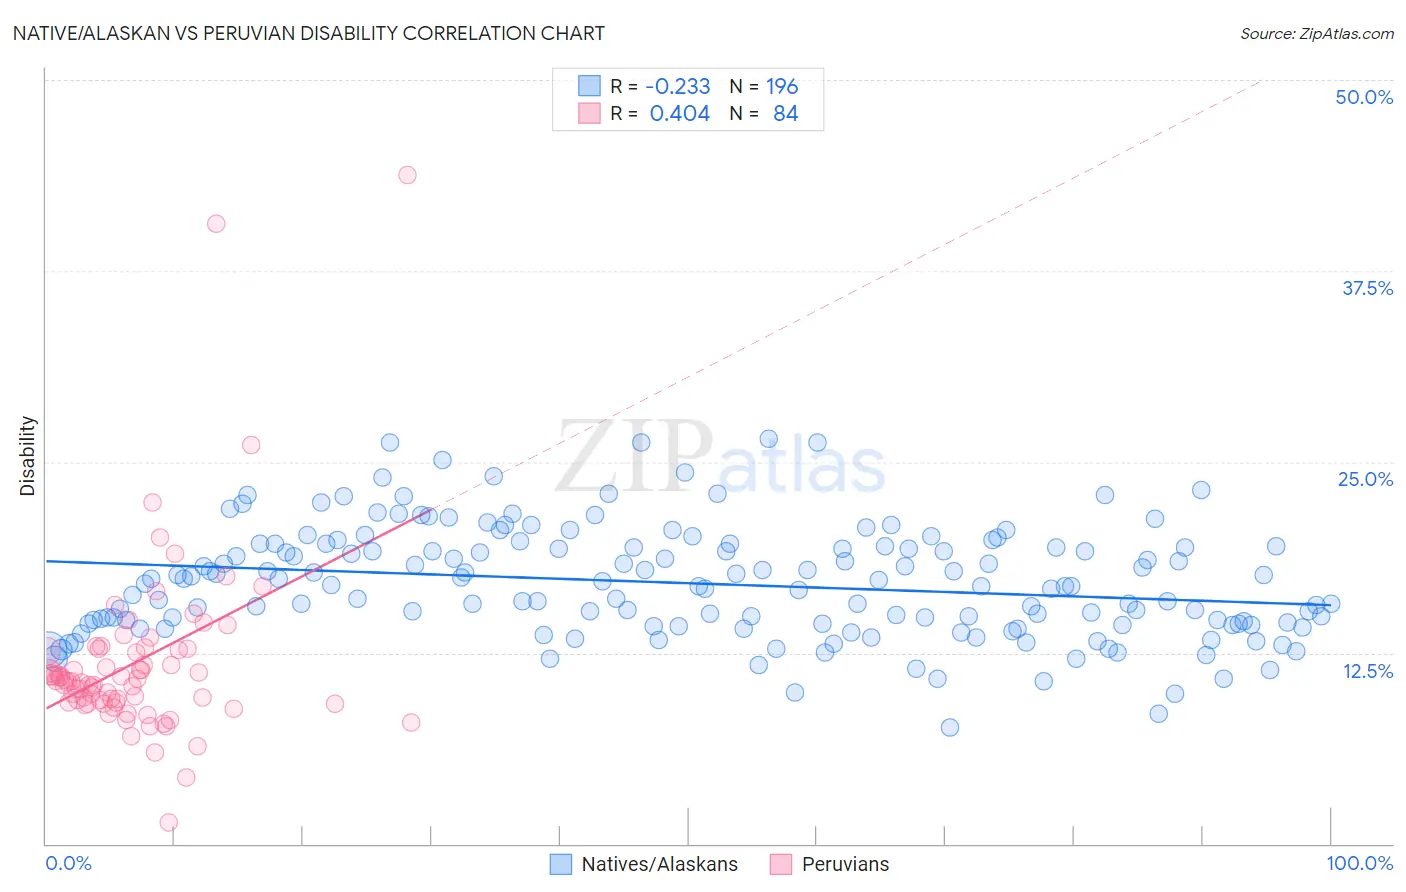
Native/Alaskan vs Peruvian Disability Correlation Chart
The statistical analysis conducted on geographies consisting of 512,916,136 people shows a weak negative correlation between the proportion of Natives/Alaskans and percentage of population with a disability in the United States with a correlation coefficient (R) of -0.233 and weighted average of 14.2%. Similarly, the statistical analysis conducted on geographies consisting of 363,197,931 people shows a moderate positive correlation between the proportion of Peruvians and percentage of population with a disability in the United States with a correlation coefficient (R) of 0.404 and weighted average of 10.9%, a difference of 30.3%.
Disability Correlation Summary
| Measurement | Native/Alaskan | Peruvian |
| Minimum | 7.6% | 1.4% |
| Maximum | 26.5% | 43.8% |
| Range | 18.9% | 42.4% |
| Mean | 17.1% | 11.9% |
| Median | 16.9% | 10.7% |
| Interquartile 25% (IQ1) | 14.4% | 9.2% |
| Interquartile 75% (IQ3) | 19.5% | 12.7% |
| Interquartile Range (IQR) | 5.1% | 3.5% |
| Standard Deviation (Sample) | 3.6% | 6.0% |
| Standard Deviation (Population) | 3.6% | 5.9% |
Similar Demographics by Disability
Demographics Similar to Natives/Alaskans by Disability
In terms of disability, the demographic groups most similar to Natives/Alaskans are Osage (14.2%, a difference of 0.030%), Chippewa (14.1%, a difference of 0.050%), Ottawa (14.2%, a difference of 0.060%), Immigrants from the Azores (14.2%, a difference of 0.060%), and Potawatomi (14.2%, a difference of 0.17%).
| Demographics | Rating | Rank | Disability |
| Menominee | 0.0 /100 | #318 | Tragic 13.8% |
| Iroquois | 0.0 /100 | #319 | Tragic 13.8% |
| Apache | 0.0 /100 | #320 | Tragic 13.9% |
| Paiute | 0.0 /100 | #321 | Tragic 13.9% |
| Americans | 0.0 /100 | #322 | Tragic 13.9% |
| Comanche | 0.0 /100 | #323 | Tragic 14.1% |
| Chippewa | 0.0 /100 | #324 | Tragic 14.1% |
| Natives/Alaskans | 0.0 /100 | #325 | Tragic 14.2% |
| Osage | 0.0 /100 | #326 | Tragic 14.2% |
| Ottawa | 0.0 /100 | #327 | Tragic 14.2% |
| Immigrants | Azores | 0.0 /100 | #328 | Tragic 14.2% |
| Potawatomi | 0.0 /100 | #329 | Tragic 14.2% |
| Navajo | 0.0 /100 | #330 | Tragic 14.3% |
| Alaskan Athabascans | 0.0 /100 | #331 | Tragic 14.4% |
| Pueblo | 0.0 /100 | #332 | Tragic 14.4% |
Demographics Similar to Peruvians by Disability
In terms of disability, the demographic groups most similar to Peruvians are Vietnamese (10.9%, a difference of 0.010%), Immigrants from Saudi Arabia (10.9%, a difference of 0.010%), South American (10.9%, a difference of 0.060%), Soviet Union (10.9%, a difference of 0.070%), and Immigrants from Spain (10.9%, a difference of 0.080%).
| Demographics | Rating | Rank | Disability |
| Immigrants | Japan | 99.9 /100 | #44 | Exceptional 10.8% |
| Immigrants | Peru | 99.9 /100 | #45 | Exceptional 10.8% |
| Tongans | 99.9 /100 | #46 | Exceptional 10.8% |
| Taiwanese | 99.9 /100 | #47 | Exceptional 10.8% |
| Soviet Union | 99.9 /100 | #48 | Exceptional 10.9% |
| Vietnamese | 99.9 /100 | #49 | Exceptional 10.9% |
| Immigrants | Saudi Arabia | 99.9 /100 | #50 | Exceptional 10.9% |
| Peruvians | 99.8 /100 | #51 | Exceptional 10.9% |
| South Americans | 99.8 /100 | #52 | Exceptional 10.9% |
| Immigrants | Spain | 99.8 /100 | #53 | Exceptional 10.9% |
| Jordanians | 99.8 /100 | #54 | Exceptional 10.9% |
| Immigrants | El Salvador | 99.8 /100 | #55 | Exceptional 10.9% |
| Immigrants | Lithuania | 99.8 /100 | #56 | Exceptional 10.9% |
| Salvadorans | 99.8 /100 | #57 | Exceptional 10.9% |
| Immigrants | South America | 99.8 /100 | #58 | Exceptional 10.9% |