Native/Alaskan vs Nigerian Disability Age 18 to 34
COMPARE
Native/Alaskan
Nigerian
Disability Age 18 to 34
Disability Age 18 to 34 Comparison
Natives/Alaskans
Nigerians
8.2%
DISABILITY AGE 18 TO 34
0.0/ 100
METRIC RATING
325th/ 347
METRIC RANK
6.6%
DISABILITY AGE 18 TO 34
43.7/ 100
METRIC RATING
178th/ 347
METRIC RANK
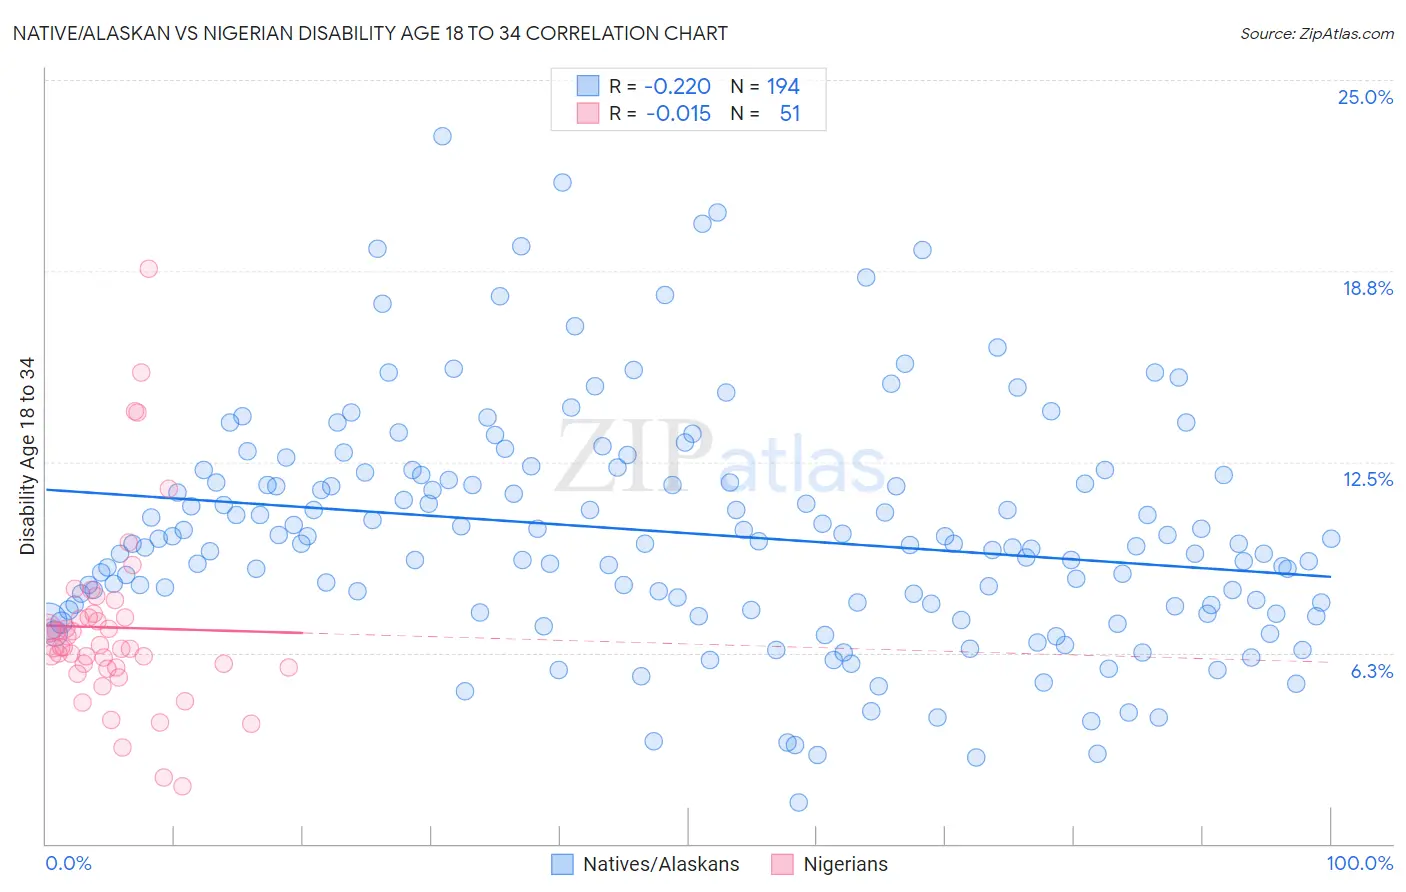
Native/Alaskan vs Nigerian Disability Age 18 to 34 Correlation Chart
The statistical analysis conducted on geographies consisting of 510,415,530 people shows a weak negative correlation between the proportion of Natives/Alaskans and percentage of population with a disability between the ages 18 and 35 in the United States with a correlation coefficient (R) of -0.220 and weighted average of 8.2%. Similarly, the statistical analysis conducted on geographies consisting of 332,463,027 people shows no correlation between the proportion of Nigerians and percentage of population with a disability between the ages 18 and 35 in the United States with a correlation coefficient (R) of -0.015 and weighted average of 6.6%, a difference of 23.9%.
Disability Age 18 to 34 Correlation Summary
| Measurement | Native/Alaskan | Nigerian |
| Minimum | 1.4% | 1.9% |
| Maximum | 23.1% | 18.8% |
| Range | 21.8% | 17.0% |
| Mean | 10.2% | 7.1% |
| Median | 9.8% | 6.4% |
| Interquartile 25% (IQ1) | 7.8% | 5.8% |
| Interquartile 75% (IQ3) | 12.1% | 7.4% |
| Interquartile Range (IQR) | 4.2% | 1.7% |
| Standard Deviation (Sample) | 3.8% | 3.1% |
| Standard Deviation (Population) | 3.8% | 3.1% |
Similar Demographics by Disability Age 18 to 34
Demographics Similar to Natives/Alaskans by Disability Age 18 to 34
In terms of disability age 18 to 34, the demographic groups most similar to Natives/Alaskans are Potawatomi (8.2%, a difference of 0.020%), Sioux (8.2%, a difference of 0.14%), Delaware (8.2%, a difference of 0.19%), Cajun (8.2%, a difference of 0.52%), and French American Indian (8.2%, a difference of 0.56%).
| Demographics | Rating | Rank | Disability Age 18 to 34 |
| French Canadians | 0.0 /100 | #318 | Tragic 8.1% |
| Aleuts | 0.0 /100 | #319 | Tragic 8.1% |
| Navajo | 0.0 /100 | #320 | Tragic 8.1% |
| Blackfeet | 0.0 /100 | #321 | Tragic 8.1% |
| Cree | 0.0 /100 | #322 | Tragic 8.1% |
| French American Indians | 0.0 /100 | #323 | Tragic 8.2% |
| Cajuns | 0.0 /100 | #324 | Tragic 8.2% |
| Natives/Alaskans | 0.0 /100 | #325 | Tragic 8.2% |
| Potawatomi | 0.0 /100 | #326 | Tragic 8.2% |
| Sioux | 0.0 /100 | #327 | Tragic 8.2% |
| Delaware | 0.0 /100 | #328 | Tragic 8.2% |
| Crow | 0.0 /100 | #329 | Tragic 8.3% |
| Osage | 0.0 /100 | #330 | Tragic 8.3% |
| Comanche | 0.0 /100 | #331 | Tragic 8.3% |
| Puget Sound Salish | 0.0 /100 | #332 | Tragic 8.3% |
Demographics Similar to Nigerians by Disability Age 18 to 34
In terms of disability age 18 to 34, the demographic groups most similar to Nigerians are Syrian (6.6%, a difference of 0.040%), Immigrants from Ghana (6.6%, a difference of 0.11%), Immigrants from Africa (6.6%, a difference of 0.15%), Immigrants from Cambodia (6.6%, a difference of 0.19%), and Immigrants from Austria (6.6%, a difference of 0.29%).
| Demographics | Rating | Rank | Disability Age 18 to 34 |
| Bahamians | 55.5 /100 | #171 | Average 6.6% |
| Ghanaians | 54.7 /100 | #172 | Average 6.6% |
| Immigrants | Mexico | 54.1 /100 | #173 | Average 6.6% |
| Native Hawaiians | 50.0 /100 | #174 | Average 6.6% |
| Immigrants | Cambodia | 46.5 /100 | #175 | Average 6.6% |
| Immigrants | Africa | 45.9 /100 | #176 | Average 6.6% |
| Syrians | 44.3 /100 | #177 | Average 6.6% |
| Nigerians | 43.7 /100 | #178 | Average 6.6% |
| Immigrants | Ghana | 42.1 /100 | #179 | Average 6.6% |
| Immigrants | Austria | 39.6 /100 | #180 | Fair 6.6% |
| Romanians | 39.5 /100 | #181 | Fair 6.6% |
| U.S. Virgin Islanders | 38.6 /100 | #182 | Fair 6.7% |
| Immigrants | Iraq | 37.4 /100 | #183 | Fair 6.7% |
| Iraqis | 37.4 /100 | #184 | Fair 6.7% |
| Immigrants | Oceania | 35.4 /100 | #185 | Fair 6.7% |