Native/Alaskan vs Australian Disability Age 18 to 34
COMPARE
Native/Alaskan
Australian
Disability Age 18 to 34
Disability Age 18 to 34 Comparison
Natives/Alaskans
Australians
8.2%
DISABILITY AGE 18 TO 34
0.0/ 100
METRIC RATING
325th/ 347
METRIC RANK
6.8%
DISABILITY AGE 18 TO 34
19.4/ 100
METRIC RATING
198th/ 347
METRIC RANK
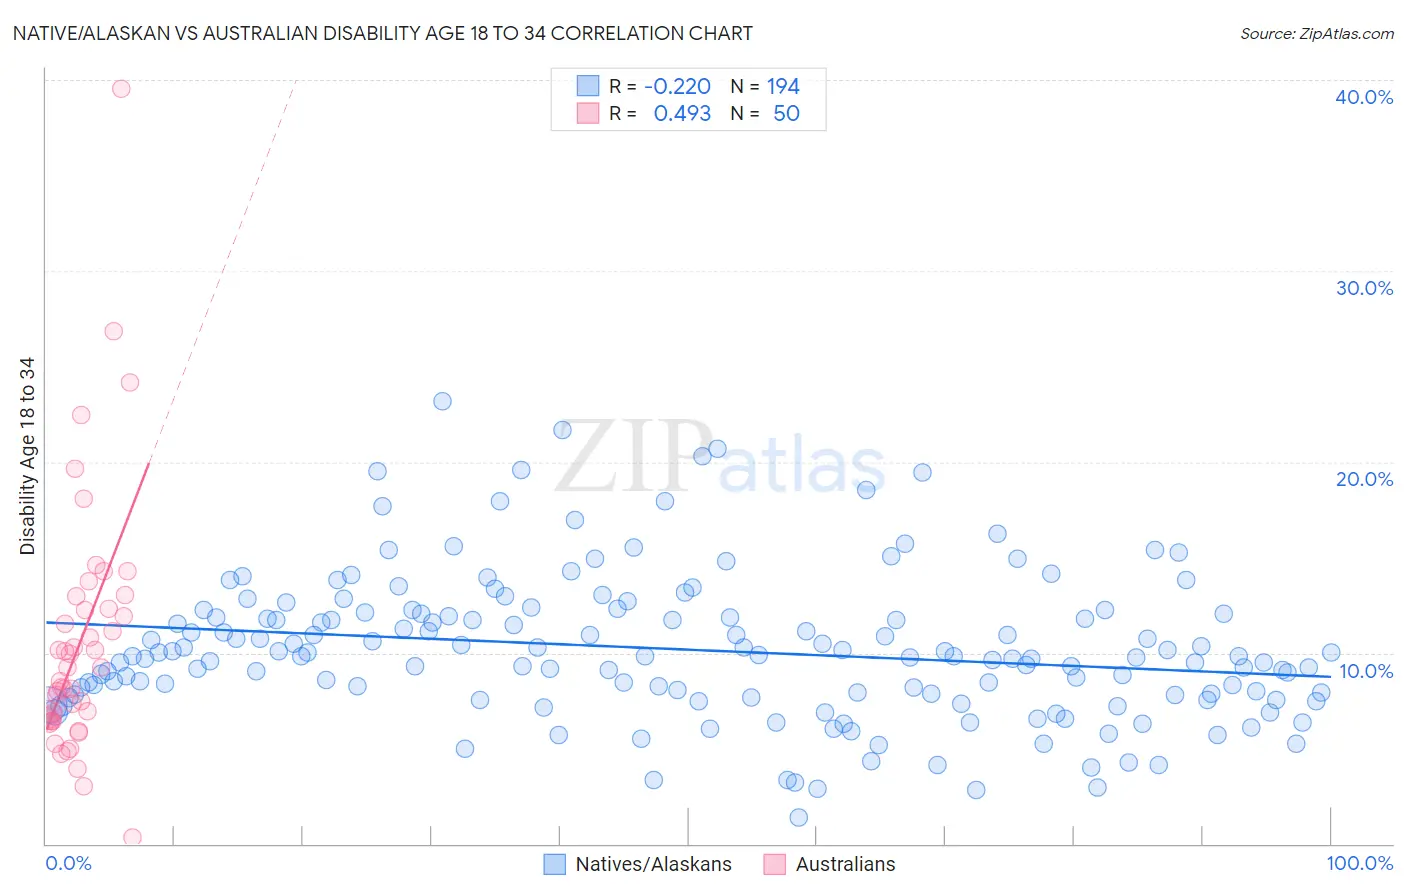
Native/Alaskan vs Australian Disability Age 18 to 34 Correlation Chart
The statistical analysis conducted on geographies consisting of 510,415,530 people shows a weak negative correlation between the proportion of Natives/Alaskans and percentage of population with a disability between the ages 18 and 35 in the United States with a correlation coefficient (R) of -0.220 and weighted average of 8.2%. Similarly, the statistical analysis conducted on geographies consisting of 223,842,296 people shows a moderate positive correlation between the proportion of Australians and percentage of population with a disability between the ages 18 and 35 in the United States with a correlation coefficient (R) of 0.493 and weighted average of 6.8%, a difference of 21.5%.
Disability Age 18 to 34 Correlation Summary
| Measurement | Native/Alaskan | Australian |
| Minimum | 1.4% | 0.32% |
| Maximum | 23.1% | 39.5% |
| Range | 21.8% | 39.2% |
| Mean | 10.2% | 10.6% |
| Median | 9.8% | 8.9% |
| Interquartile 25% (IQ1) | 7.8% | 6.6% |
| Interquartile 75% (IQ3) | 12.1% | 12.3% |
| Interquartile Range (IQR) | 4.2% | 5.7% |
| Standard Deviation (Sample) | 3.8% | 6.7% |
| Standard Deviation (Population) | 3.8% | 6.6% |
Similar Demographics by Disability Age 18 to 34
Demographics Similar to Natives/Alaskans by Disability Age 18 to 34
In terms of disability age 18 to 34, the demographic groups most similar to Natives/Alaskans are Potawatomi (8.2%, a difference of 0.020%), Sioux (8.2%, a difference of 0.14%), Delaware (8.2%, a difference of 0.19%), Cajun (8.2%, a difference of 0.52%), and French American Indian (8.2%, a difference of 0.56%).
| Demographics | Rating | Rank | Disability Age 18 to 34 |
| French Canadians | 0.0 /100 | #318 | Tragic 8.1% |
| Aleuts | 0.0 /100 | #319 | Tragic 8.1% |
| Navajo | 0.0 /100 | #320 | Tragic 8.1% |
| Blackfeet | 0.0 /100 | #321 | Tragic 8.1% |
| Cree | 0.0 /100 | #322 | Tragic 8.1% |
| French American Indians | 0.0 /100 | #323 | Tragic 8.2% |
| Cajuns | 0.0 /100 | #324 | Tragic 8.2% |
| Natives/Alaskans | 0.0 /100 | #325 | Tragic 8.2% |
| Potawatomi | 0.0 /100 | #326 | Tragic 8.2% |
| Sioux | 0.0 /100 | #327 | Tragic 8.2% |
| Delaware | 0.0 /100 | #328 | Tragic 8.2% |
| Crow | 0.0 /100 | #329 | Tragic 8.3% |
| Osage | 0.0 /100 | #330 | Tragic 8.3% |
| Comanche | 0.0 /100 | #331 | Tragic 8.3% |
| Puget Sound Salish | 0.0 /100 | #332 | Tragic 8.3% |
Demographics Similar to Australians by Disability Age 18 to 34
In terms of disability age 18 to 34, the demographic groups most similar to Australians are Estonian (6.8%, a difference of 0.13%), Kenyan (6.8%, a difference of 0.13%), Immigrants from Netherlands (6.7%, a difference of 0.16%), Sierra Leonean (6.8%, a difference of 0.22%), and Mexican American Indian (6.7%, a difference of 0.29%).
| Demographics | Rating | Rank | Disability Age 18 to 34 |
| Immigrants | Eastern Africa | 33.2 /100 | #191 | Fair 6.7% |
| Immigrants | Western Africa | 28.3 /100 | #192 | Fair 6.7% |
| Immigrants | Uganda | 25.1 /100 | #193 | Fair 6.7% |
| Immigrants | Sudan | 24.9 /100 | #194 | Fair 6.7% |
| Mexican American Indians | 22.3 /100 | #195 | Fair 6.7% |
| Immigrants | Netherlands | 21.0 /100 | #196 | Fair 6.7% |
| Estonians | 20.6 /100 | #197 | Fair 6.8% |
| Australians | 19.4 /100 | #198 | Poor 6.8% |
| Kenyans | 18.3 /100 | #199 | Poor 6.8% |
| Sierra Leoneans | 17.5 /100 | #200 | Poor 6.8% |
| Greeks | 16.1 /100 | #201 | Poor 6.8% |
| Panamanians | 15.8 /100 | #202 | Poor 6.8% |
| Hispanics or Latinos | 13.8 /100 | #203 | Poor 6.8% |
| Immigrants | Bosnia and Herzegovina | 13.6 /100 | #204 | Poor 6.8% |
| Lebanese | 13.3 /100 | #205 | Poor 6.8% |