Native/Alaskan vs South American Indian Disability Age 18 to 34
COMPARE
Native/Alaskan
South American Indian
Disability Age 18 to 34
Disability Age 18 to 34 Comparison
Natives/Alaskans
South American Indians
8.2%
DISABILITY AGE 18 TO 34
0.0/ 100
METRIC RATING
325th/ 347
METRIC RANK
6.4%
DISABILITY AGE 18 TO 34
86.5/ 100
METRIC RATING
142nd/ 347
METRIC RANK
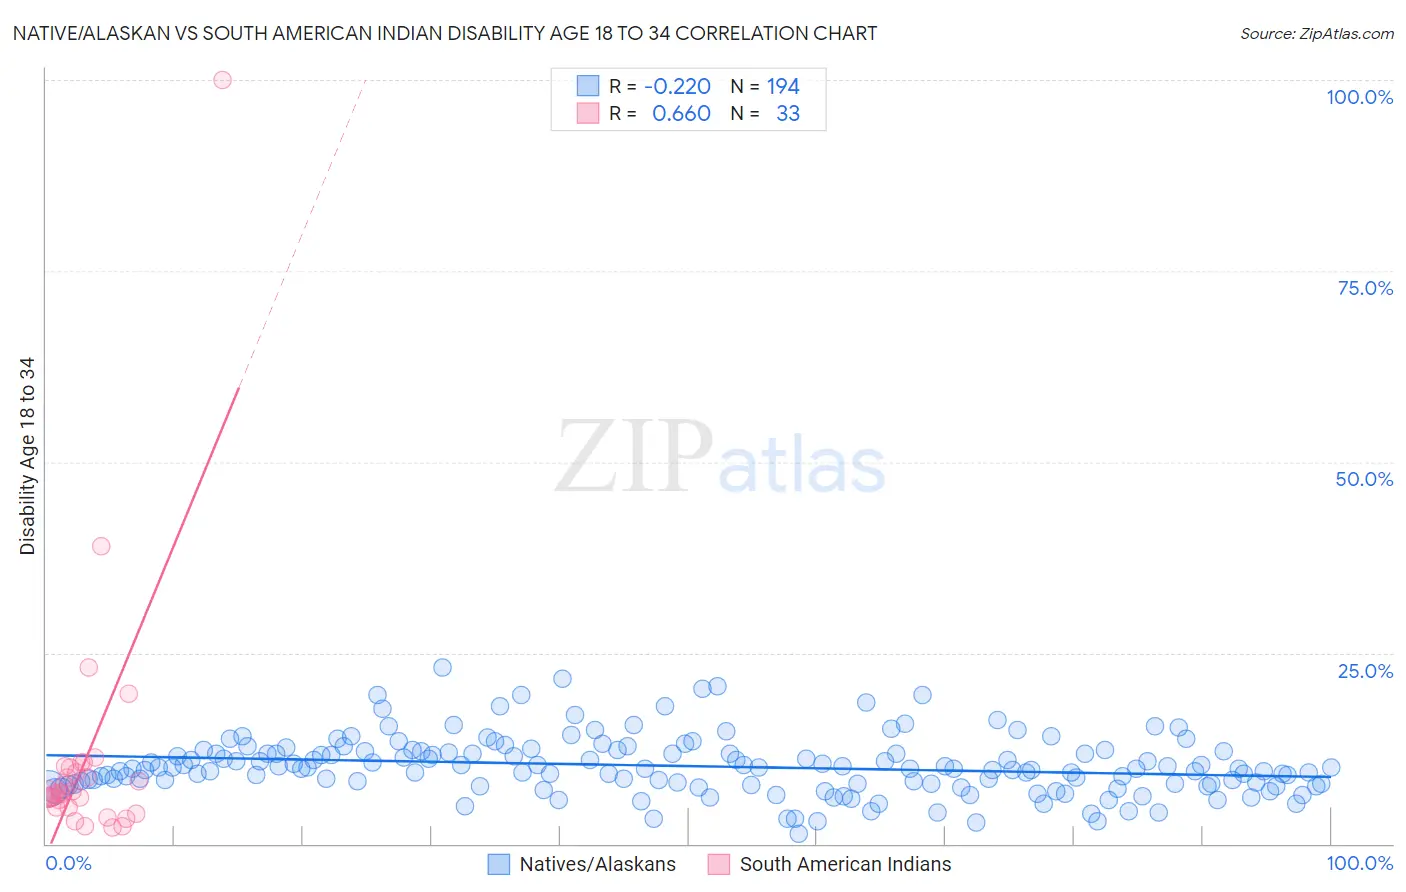
Native/Alaskan vs South American Indian Disability Age 18 to 34 Correlation Chart
The statistical analysis conducted on geographies consisting of 510,415,530 people shows a weak negative correlation between the proportion of Natives/Alaskans and percentage of population with a disability between the ages 18 and 35 in the United States with a correlation coefficient (R) of -0.220 and weighted average of 8.2%. Similarly, the statistical analysis conducted on geographies consisting of 164,481,999 people shows a significant positive correlation between the proportion of South American Indians and percentage of population with a disability between the ages 18 and 35 in the United States with a correlation coefficient (R) of 0.660 and weighted average of 6.4%, a difference of 28.6%.
Disability Age 18 to 34 Correlation Summary
| Measurement | Native/Alaskan | South American Indian |
| Minimum | 1.4% | 2.2% |
| Maximum | 23.1% | 100.0% |
| Range | 21.8% | 97.8% |
| Mean | 10.2% | 11.2% |
| Median | 9.8% | 6.5% |
| Interquartile 25% (IQ1) | 7.8% | 4.8% |
| Interquartile 75% (IQ3) | 12.1% | 10.0% |
| Interquartile Range (IQR) | 4.2% | 5.2% |
| Standard Deviation (Sample) | 3.8% | 17.4% |
| Standard Deviation (Population) | 3.8% | 17.2% |
Similar Demographics by Disability Age 18 to 34
Demographics Similar to Natives/Alaskans by Disability Age 18 to 34
In terms of disability age 18 to 34, the demographic groups most similar to Natives/Alaskans are Potawatomi (8.2%, a difference of 0.020%), Sioux (8.2%, a difference of 0.14%), Delaware (8.2%, a difference of 0.19%), Cajun (8.2%, a difference of 0.52%), and French American Indian (8.2%, a difference of 0.56%).
| Demographics | Rating | Rank | Disability Age 18 to 34 |
| French Canadians | 0.0 /100 | #318 | Tragic 8.1% |
| Aleuts | 0.0 /100 | #319 | Tragic 8.1% |
| Navajo | 0.0 /100 | #320 | Tragic 8.1% |
| Blackfeet | 0.0 /100 | #321 | Tragic 8.1% |
| Cree | 0.0 /100 | #322 | Tragic 8.1% |
| French American Indians | 0.0 /100 | #323 | Tragic 8.2% |
| Cajuns | 0.0 /100 | #324 | Tragic 8.2% |
| Natives/Alaskans | 0.0 /100 | #325 | Tragic 8.2% |
| Potawatomi | 0.0 /100 | #326 | Tragic 8.2% |
| Sioux | 0.0 /100 | #327 | Tragic 8.2% |
| Delaware | 0.0 /100 | #328 | Tragic 8.2% |
| Crow | 0.0 /100 | #329 | Tragic 8.3% |
| Osage | 0.0 /100 | #330 | Tragic 8.3% |
| Comanche | 0.0 /100 | #331 | Tragic 8.3% |
| Puget Sound Salish | 0.0 /100 | #332 | Tragic 8.3% |
Demographics Similar to South American Indians by Disability Age 18 to 34
In terms of disability age 18 to 34, the demographic groups most similar to South American Indians are Immigrants from Latvia (6.4%, a difference of 0.020%), Jamaican (6.4%, a difference of 0.030%), Immigrants from Fiji (6.4%, a difference of 0.12%), Immigrants from Belize (6.4%, a difference of 0.14%), and Immigrants from Honduras (6.4%, a difference of 0.19%).
| Demographics | Rating | Rank | Disability Age 18 to 34 |
| Palestinians | 88.5 /100 | #135 | Excellent 6.4% |
| Immigrants | Sweden | 88.5 /100 | #136 | Excellent 6.4% |
| Immigrants | Honduras | 87.7 /100 | #137 | Excellent 6.4% |
| Spanish American Indians | 87.7 /100 | #138 | Excellent 6.4% |
| Immigrants | Belize | 87.4 /100 | #139 | Excellent 6.4% |
| Immigrants | Fiji | 87.3 /100 | #140 | Excellent 6.4% |
| Jamaicans | 86.8 /100 | #141 | Excellent 6.4% |
| South American Indians | 86.5 /100 | #142 | Excellent 6.4% |
| Immigrants | Latvia | 86.4 /100 | #143 | Excellent 6.4% |
| Albanians | 85.3 /100 | #144 | Excellent 6.4% |
| Moroccans | 85.2 /100 | #145 | Excellent 6.4% |
| Belizeans | 84.9 /100 | #146 | Excellent 6.4% |
| Immigrants | South Africa | 83.7 /100 | #147 | Excellent 6.4% |
| Immigrants | Belgium | 83.5 /100 | #148 | Excellent 6.4% |
| Hondurans | 83.1 /100 | #149 | Excellent 6.4% |