Subsaharan African vs Nigerian Disability Age 18 to 34
COMPARE
Subsaharan African
Nigerian
Disability Age 18 to 34
Disability Age 18 to 34 Comparison
Sub-Saharan Africans
Nigerians
7.1%
DISABILITY AGE 18 TO 34
1.7/ 100
METRIC RATING
235th/ 347
METRIC RANK
6.6%
DISABILITY AGE 18 TO 34
43.7/ 100
METRIC RATING
178th/ 347
METRIC RANK
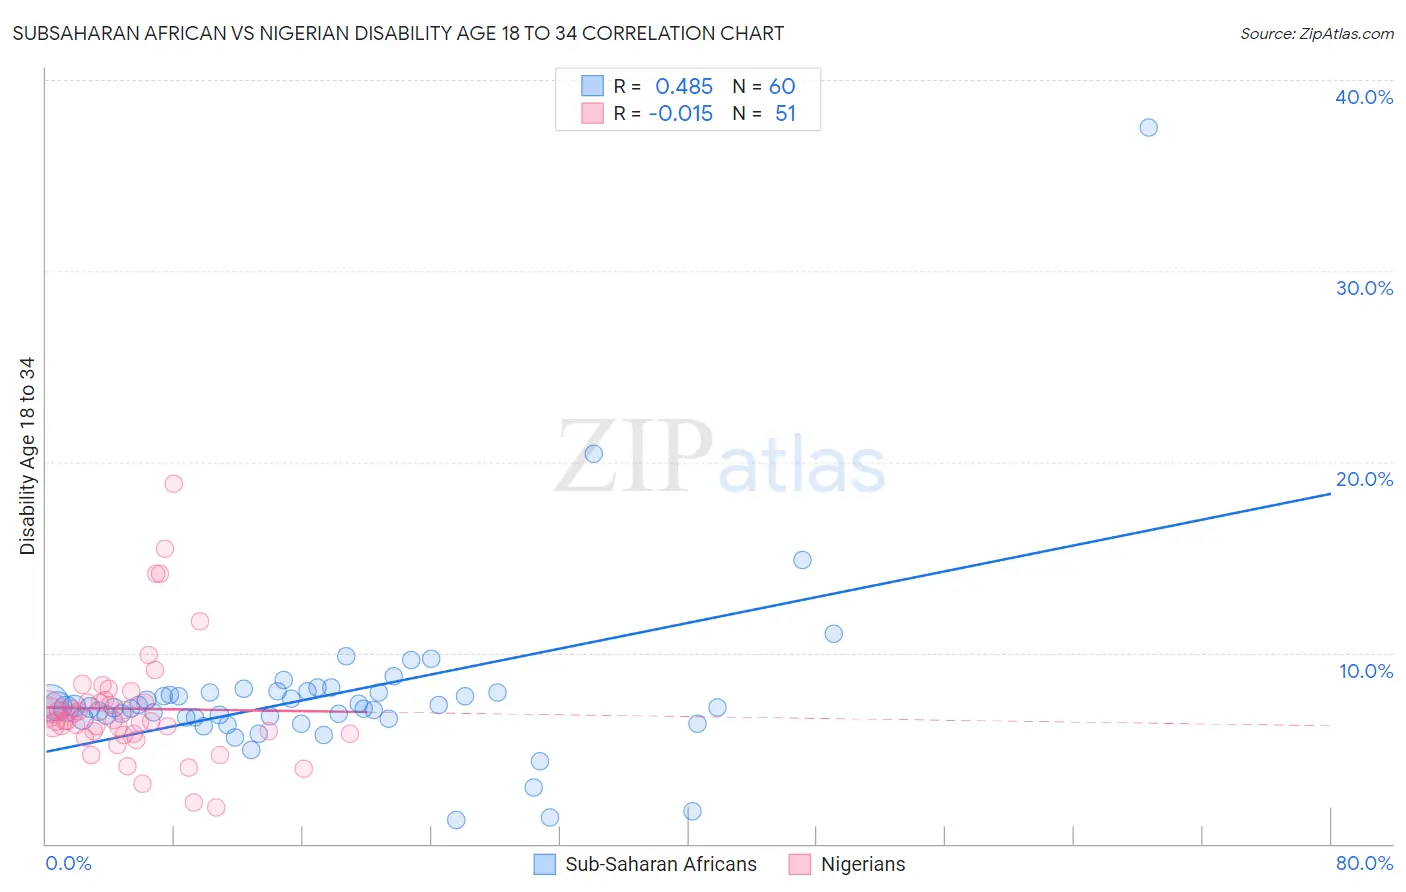
Subsaharan African vs Nigerian Disability Age 18 to 34 Correlation Chart
The statistical analysis conducted on geographies consisting of 506,334,183 people shows a moderate positive correlation between the proportion of Sub-Saharan Africans and percentage of population with a disability between the ages 18 and 35 in the United States with a correlation coefficient (R) of 0.485 and weighted average of 7.1%. Similarly, the statistical analysis conducted on geographies consisting of 332,463,027 people shows no correlation between the proportion of Nigerians and percentage of population with a disability between the ages 18 and 35 in the United States with a correlation coefficient (R) of -0.015 and weighted average of 6.6%, a difference of 6.6%.
Disability Age 18 to 34 Correlation Summary
| Measurement | Subsaharan African | Nigerian |
| Minimum | 1.2% | 1.9% |
| Maximum | 37.5% | 18.8% |
| Range | 36.3% | 17.0% |
| Mean | 7.8% | 7.1% |
| Median | 7.1% | 6.4% |
| Interquartile 25% (IQ1) | 6.6% | 5.8% |
| Interquartile 75% (IQ3) | 7.9% | 7.4% |
| Interquartile Range (IQR) | 1.4% | 1.7% |
| Standard Deviation (Sample) | 4.7% | 3.1% |
| Standard Deviation (Population) | 4.7% | 3.1% |
Similar Demographics by Disability Age 18 to 34
Demographics Similar to Sub-Saharan Africans by Disability Age 18 to 34
In terms of disability age 18 to 34, the demographic groups most similar to Sub-Saharan Africans are Liberian (7.1%, a difference of 0.25%), Alsatian (7.0%, a difference of 0.37%), Austrian (7.1%, a difference of 0.42%), Marshallese (7.1%, a difference of 0.47%), and Italian (7.1%, a difference of 0.58%).
| Demographics | Rating | Rank | Disability Age 18 to 34 |
| Immigrants | Yemen | 4.2 /100 | #228 | Tragic 7.0% |
| Lithuanians | 4.1 /100 | #229 | Tragic 7.0% |
| Immigrants | North America | 3.9 /100 | #230 | Tragic 7.0% |
| Ute | 3.8 /100 | #231 | Tragic 7.0% |
| Samoans | 3.2 /100 | #232 | Tragic 7.0% |
| New Zealanders | 2.7 /100 | #233 | Tragic 7.0% |
| Alsatians | 2.1 /100 | #234 | Tragic 7.0% |
| Sub-Saharan Africans | 1.7 /100 | #235 | Tragic 7.1% |
| Liberians | 1.5 /100 | #236 | Tragic 7.1% |
| Austrians | 1.3 /100 | #237 | Tragic 7.1% |
| Marshallese | 1.3 /100 | #238 | Tragic 7.1% |
| Italians | 1.2 /100 | #239 | Tragic 7.1% |
| Arapaho | 1.1 /100 | #240 | Tragic 7.1% |
| Nepalese | 1.1 /100 | #241 | Tragic 7.1% |
| Immigrants | Congo | 1.1 /100 | #242 | Tragic 7.1% |
Demographics Similar to Nigerians by Disability Age 18 to 34
In terms of disability age 18 to 34, the demographic groups most similar to Nigerians are Syrian (6.6%, a difference of 0.040%), Immigrants from Ghana (6.6%, a difference of 0.11%), Immigrants from Africa (6.6%, a difference of 0.15%), Immigrants from Cambodia (6.6%, a difference of 0.19%), and Immigrants from Austria (6.6%, a difference of 0.29%).
| Demographics | Rating | Rank | Disability Age 18 to 34 |
| Bahamians | 55.5 /100 | #171 | Average 6.6% |
| Ghanaians | 54.7 /100 | #172 | Average 6.6% |
| Immigrants | Mexico | 54.1 /100 | #173 | Average 6.6% |
| Native Hawaiians | 50.0 /100 | #174 | Average 6.6% |
| Immigrants | Cambodia | 46.5 /100 | #175 | Average 6.6% |
| Immigrants | Africa | 45.9 /100 | #176 | Average 6.6% |
| Syrians | 44.3 /100 | #177 | Average 6.6% |
| Nigerians | 43.7 /100 | #178 | Average 6.6% |
| Immigrants | Ghana | 42.1 /100 | #179 | Average 6.6% |
| Immigrants | Austria | 39.6 /100 | #180 | Fair 6.6% |
| Romanians | 39.5 /100 | #181 | Fair 6.6% |
| U.S. Virgin Islanders | 38.6 /100 | #182 | Fair 6.7% |
| Immigrants | Iraq | 37.4 /100 | #183 | Fair 6.7% |
| Iraqis | 37.4 /100 | #184 | Fair 6.7% |
| Immigrants | Oceania | 35.4 /100 | #185 | Fair 6.7% |