Native/Alaskan vs Nigerian 12th Grade, No Diploma
COMPARE
Native/Alaskan
Nigerian
12th Grade, No Diploma
12th Grade, No Diploma Comparison
Natives/Alaskans
Nigerians
87.7%
12TH GRADE, NO DIPLOMA
0.0/ 100
METRIC RATING
306th/ 347
METRIC RANK
90.3%
12TH GRADE, NO DIPLOMA
4.5/ 100
METRIC RATING
227th/ 347
METRIC RANK
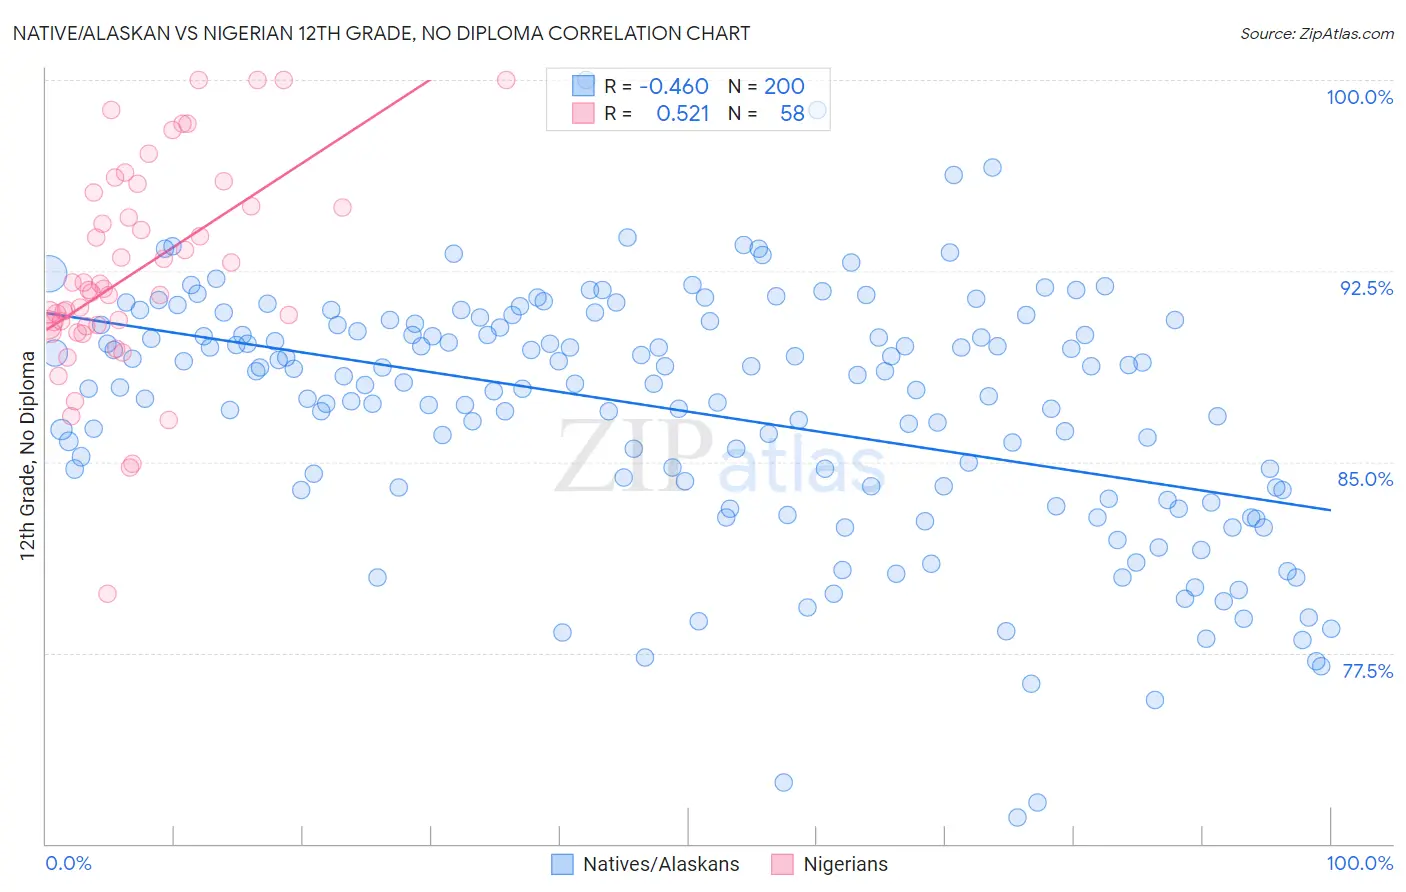
Native/Alaskan vs Nigerian 12th Grade, No Diploma Correlation Chart
The statistical analysis conducted on geographies consisting of 513,075,812 people shows a moderate negative correlation between the proportion of Natives/Alaskans and percentage of population with at least 12th grade (no diploma) education in the United States with a correlation coefficient (R) of -0.460 and weighted average of 87.7%. Similarly, the statistical analysis conducted on geographies consisting of 332,724,627 people shows a substantial positive correlation between the proportion of Nigerians and percentage of population with at least 12th grade (no diploma) education in the United States with a correlation coefficient (R) of 0.521 and weighted average of 90.3%, a difference of 3.0%.
12th Grade, No Diploma Correlation Summary
| Measurement | Native/Alaskan | Nigerian |
| Minimum | 71.1% | 79.8% |
| Maximum | 100.0% | 100.0% |
| Range | 28.9% | 20.2% |
| Mean | 87.0% | 92.5% |
| Median | 88.1% | 91.8% |
| Interquartile 25% (IQ1) | 83.9% | 90.4% |
| Interquartile 75% (IQ3) | 90.3% | 95.0% |
| Interquartile Range (IQR) | 6.4% | 4.7% |
| Standard Deviation (Sample) | 4.9% | 4.1% |
| Standard Deviation (Population) | 4.9% | 4.1% |
Similar Demographics by 12th Grade, No Diploma
Demographics Similar to Natives/Alaskans by 12th Grade, No Diploma
In terms of 12th grade, no diploma, the demographic groups most similar to Natives/Alaskans are Immigrants from Portugal (87.6%, a difference of 0.040%), Immigrants from Dominica (87.7%, a difference of 0.070%), Yup'ik (87.6%, a difference of 0.080%), Immigrants from Armenia (87.6%, a difference of 0.11%), and Immigrants from Cuba (87.5%, a difference of 0.16%).
| Demographics | Rating | Rank | 12th Grade, No Diploma |
| Nepalese | 0.0 /100 | #299 | Tragic 88.1% |
| Immigrants | Guyana | 0.0 /100 | #300 | Tragic 88.1% |
| Immigrants | Cambodia | 0.0 /100 | #301 | Tragic 88.1% |
| Ecuadorians | 0.0 /100 | #302 | Tragic 88.0% |
| Immigrants | Bangladesh | 0.0 /100 | #303 | Tragic 88.0% |
| Vietnamese | 0.0 /100 | #304 | Tragic 87.9% |
| Immigrants | Dominica | 0.0 /100 | #305 | Tragic 87.7% |
| Natives/Alaskans | 0.0 /100 | #306 | Tragic 87.7% |
| Immigrants | Portugal | 0.0 /100 | #307 | Tragic 87.6% |
| Yup'ik | 0.0 /100 | #308 | Tragic 87.6% |
| Immigrants | Armenia | 0.0 /100 | #309 | Tragic 87.6% |
| Immigrants | Cuba | 0.0 /100 | #310 | Tragic 87.5% |
| Yaqui | 0.0 /100 | #311 | Tragic 87.5% |
| Immigrants | Ecuador | 0.0 /100 | #312 | Tragic 87.5% |
| Immigrants | Caribbean | 0.0 /100 | #313 | Tragic 87.4% |
Demographics Similar to Nigerians by 12th Grade, No Diploma
In terms of 12th grade, no diploma, the demographic groups most similar to Nigerians are Immigrants from Zaire (90.3%, a difference of 0.010%), Immigrants from Panama (90.3%, a difference of 0.020%), Chickasaw (90.3%, a difference of 0.020%), South American (90.3%, a difference of 0.030%), and Immigrants from Somalia (90.4%, a difference of 0.050%).
| Demographics | Rating | Rank | 12th Grade, No Diploma |
| Colombians | 6.6 /100 | #220 | Tragic 90.4% |
| Immigrants | Liberia | 5.7 /100 | #221 | Tragic 90.4% |
| Immigrants | Somalia | 5.3 /100 | #222 | Tragic 90.4% |
| South Americans | 5.0 /100 | #223 | Tragic 90.3% |
| Immigrants | Panama | 4.8 /100 | #224 | Tragic 90.3% |
| Chickasaw | 4.8 /100 | #225 | Tragic 90.3% |
| Immigrants | Zaire | 4.6 /100 | #226 | Tragic 90.3% |
| Nigerians | 4.5 /100 | #227 | Tragic 90.3% |
| Creek | 3.9 /100 | #228 | Tragic 90.3% |
| Immigrants | Bahamas | 3.6 /100 | #229 | Tragic 90.2% |
| Immigrants | Philippines | 2.8 /100 | #230 | Tragic 90.2% |
| Peruvians | 2.7 /100 | #231 | Tragic 90.2% |
| Blackfeet | 2.4 /100 | #232 | Tragic 90.1% |
| Immigrants | Thailand | 2.3 /100 | #233 | Tragic 90.1% |
| Immigrants | South America | 2.3 /100 | #234 | Tragic 90.1% |