Native/Alaskan vs Laotian Disability Age 18 to 34
COMPARE
Native/Alaskan
Laotian
Disability Age 18 to 34
Disability Age 18 to 34 Comparison
Natives/Alaskans
Laotians
8.2%
DISABILITY AGE 18 TO 34
0.0/ 100
METRIC RATING
325th/ 347
METRIC RANK
6.2%
DISABILITY AGE 18 TO 34
96.4/ 100
METRIC RATING
102nd/ 347
METRIC RANK
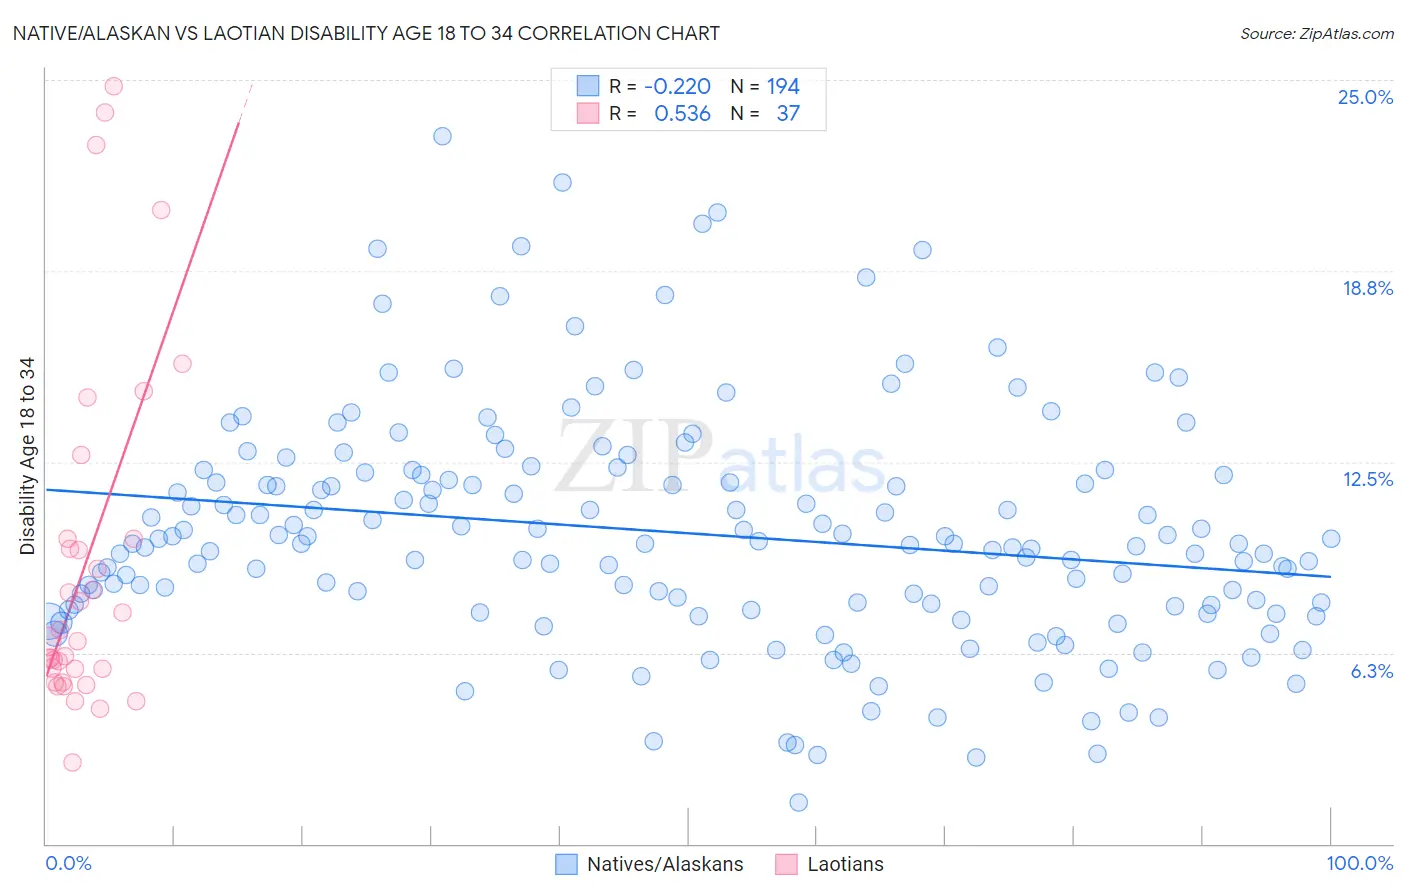
Native/Alaskan vs Laotian Disability Age 18 to 34 Correlation Chart
The statistical analysis conducted on geographies consisting of 510,415,530 people shows a weak negative correlation between the proportion of Natives/Alaskans and percentage of population with a disability between the ages 18 and 35 in the United States with a correlation coefficient (R) of -0.220 and weighted average of 8.2%. Similarly, the statistical analysis conducted on geographies consisting of 224,649,729 people shows a substantial positive correlation between the proportion of Laotians and percentage of population with a disability between the ages 18 and 35 in the United States with a correlation coefficient (R) of 0.536 and weighted average of 6.2%, a difference of 32.0%.
Disability Age 18 to 34 Correlation Summary
| Measurement | Native/Alaskan | Laotian |
| Minimum | 1.4% | 2.7% |
| Maximum | 23.1% | 24.8% |
| Range | 21.8% | 22.1% |
| Mean | 10.2% | 9.2% |
| Median | 9.8% | 6.6% |
| Interquartile 25% (IQ1) | 7.8% | 5.5% |
| Interquartile 75% (IQ3) | 12.1% | 10.0% |
| Interquartile Range (IQR) | 4.2% | 4.5% |
| Standard Deviation (Sample) | 3.8% | 5.8% |
| Standard Deviation (Population) | 3.8% | 5.7% |
Similar Demographics by Disability Age 18 to 34
Demographics Similar to Natives/Alaskans by Disability Age 18 to 34
In terms of disability age 18 to 34, the demographic groups most similar to Natives/Alaskans are Potawatomi (8.2%, a difference of 0.020%), Sioux (8.2%, a difference of 0.14%), Delaware (8.2%, a difference of 0.19%), Cajun (8.2%, a difference of 0.52%), and French American Indian (8.2%, a difference of 0.56%).
| Demographics | Rating | Rank | Disability Age 18 to 34 |
| French Canadians | 0.0 /100 | #318 | Tragic 8.1% |
| Aleuts | 0.0 /100 | #319 | Tragic 8.1% |
| Navajo | 0.0 /100 | #320 | Tragic 8.1% |
| Blackfeet | 0.0 /100 | #321 | Tragic 8.1% |
| Cree | 0.0 /100 | #322 | Tragic 8.1% |
| French American Indians | 0.0 /100 | #323 | Tragic 8.2% |
| Cajuns | 0.0 /100 | #324 | Tragic 8.2% |
| Natives/Alaskans | 0.0 /100 | #325 | Tragic 8.2% |
| Potawatomi | 0.0 /100 | #326 | Tragic 8.2% |
| Sioux | 0.0 /100 | #327 | Tragic 8.2% |
| Delaware | 0.0 /100 | #328 | Tragic 8.2% |
| Crow | 0.0 /100 | #329 | Tragic 8.3% |
| Osage | 0.0 /100 | #330 | Tragic 8.3% |
| Comanche | 0.0 /100 | #331 | Tragic 8.3% |
| Puget Sound Salish | 0.0 /100 | #332 | Tragic 8.3% |
Demographics Similar to Laotians by Disability Age 18 to 34
In terms of disability age 18 to 34, the demographic groups most similar to Laotians are Immigrants from Bulgaria (6.2%, a difference of 0.010%), Immigrants from Jamaica (6.2%, a difference of 0.020%), Mongolian (6.2%, a difference of 0.090%), Bhutanese (6.2%, a difference of 0.090%), and Immigrants from Albania (6.2%, a difference of 0.18%).
| Demographics | Rating | Rank | Disability Age 18 to 34 |
| Central Americans | 97.5 /100 | #95 | Exceptional 6.2% |
| Immigrants | Uruguay | 97.4 /100 | #96 | Exceptional 6.2% |
| Uruguayans | 97.3 /100 | #97 | Exceptional 6.2% |
| Immigrants | Syria | 97.2 /100 | #98 | Exceptional 6.2% |
| Immigrants | Ethiopia | 96.9 /100 | #99 | Exceptional 6.2% |
| Immigrants | Albania | 96.7 /100 | #100 | Exceptional 6.2% |
| Immigrants | Jamaica | 96.4 /100 | #101 | Exceptional 6.2% |
| Laotians | 96.4 /100 | #102 | Exceptional 6.2% |
| Immigrants | Bulgaria | 96.3 /100 | #103 | Exceptional 6.2% |
| Mongolians | 96.2 /100 | #104 | Exceptional 6.2% |
| Bhutanese | 96.2 /100 | #105 | Exceptional 6.2% |
| Immigrants | Afghanistan | 95.9 /100 | #106 | Exceptional 6.2% |
| Ethiopians | 95.8 /100 | #107 | Exceptional 6.2% |
| Immigrants | Croatia | 95.7 /100 | #108 | Exceptional 6.2% |
| Sri Lankans | 95.5 /100 | #109 | Exceptional 6.2% |