Native/Alaskan vs Belgian Disability Age 18 to 34
COMPARE
Native/Alaskan
Belgian
Disability Age 18 to 34
Disability Age 18 to 34 Comparison
Natives/Alaskans
Belgians
8.2%
DISABILITY AGE 18 TO 34
0.0/ 100
METRIC RATING
325th/ 347
METRIC RANK
7.4%
DISABILITY AGE 18 TO 34
0.1/ 100
METRIC RATING
270th/ 347
METRIC RANK
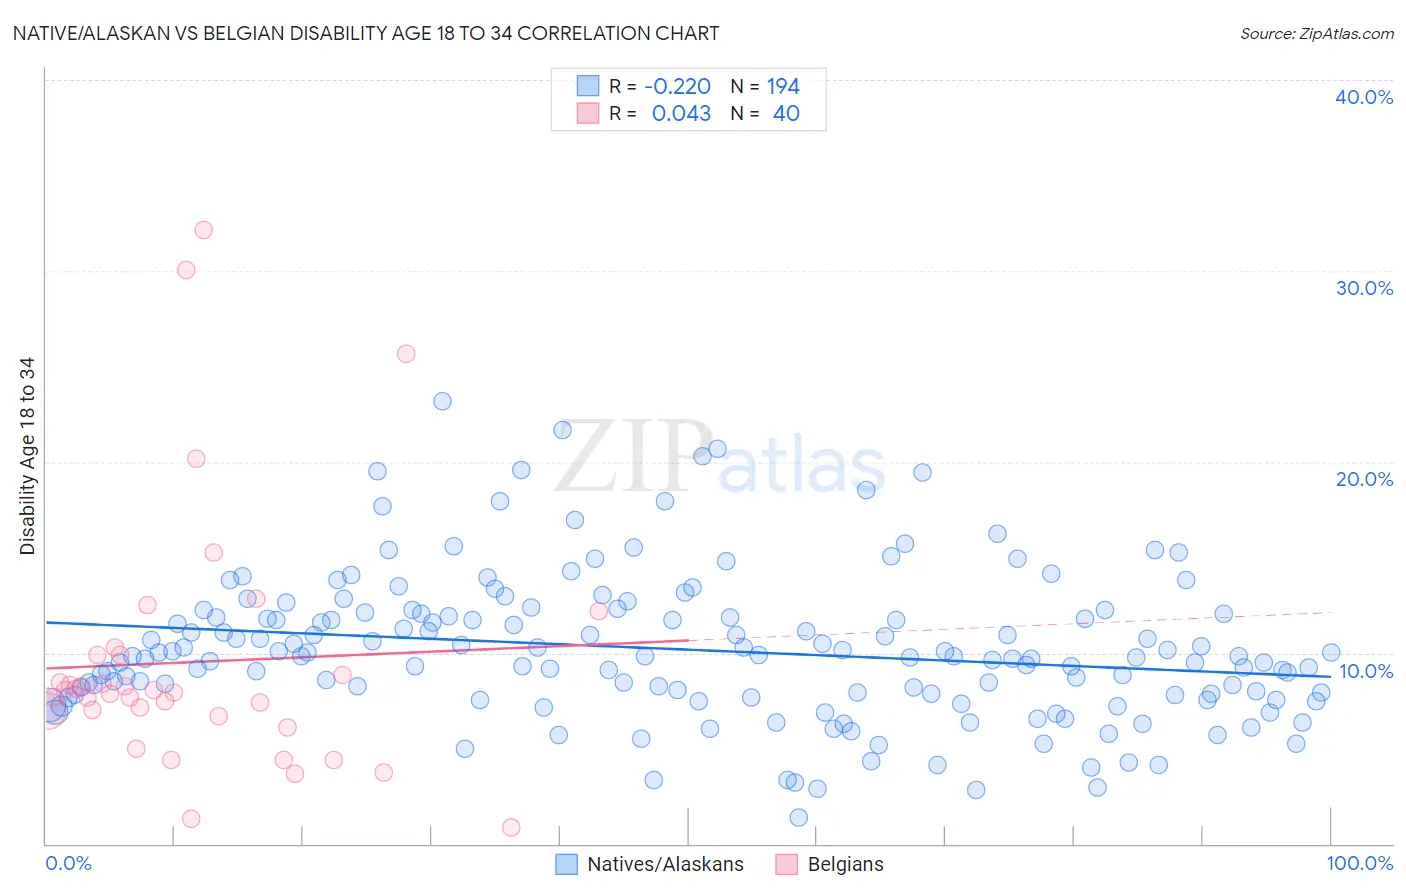
Native/Alaskan vs Belgian Disability Age 18 to 34 Correlation Chart
The statistical analysis conducted on geographies consisting of 510,415,530 people shows a weak negative correlation between the proportion of Natives/Alaskans and percentage of population with a disability between the ages 18 and 35 in the United States with a correlation coefficient (R) of -0.220 and weighted average of 8.2%. Similarly, the statistical analysis conducted on geographies consisting of 355,052,647 people shows no correlation between the proportion of Belgians and percentage of population with a disability between the ages 18 and 35 in the United States with a correlation coefficient (R) of 0.043 and weighted average of 7.4%, a difference of 11.3%.
Disability Age 18 to 34 Correlation Summary
| Measurement | Native/Alaskan | Belgian |
| Minimum | 1.4% | 0.85% |
| Maximum | 23.1% | 32.1% |
| Range | 21.8% | 31.3% |
| Mean | 10.2% | 9.5% |
| Median | 9.8% | 8.0% |
| Interquartile 25% (IQ1) | 7.8% | 6.8% |
| Interquartile 75% (IQ3) | 12.1% | 9.9% |
| Interquartile Range (IQR) | 4.2% | 3.1% |
| Standard Deviation (Sample) | 3.8% | 6.7% |
| Standard Deviation (Population) | 3.8% | 6.6% |
Similar Demographics by Disability Age 18 to 34
Demographics Similar to Natives/Alaskans by Disability Age 18 to 34
In terms of disability age 18 to 34, the demographic groups most similar to Natives/Alaskans are Potawatomi (8.2%, a difference of 0.020%), Sioux (8.2%, a difference of 0.14%), Delaware (8.2%, a difference of 0.19%), Cajun (8.2%, a difference of 0.52%), and French American Indian (8.2%, a difference of 0.56%).
| Demographics | Rating | Rank | Disability Age 18 to 34 |
| French Canadians | 0.0 /100 | #318 | Tragic 8.1% |
| Aleuts | 0.0 /100 | #319 | Tragic 8.1% |
| Navajo | 0.0 /100 | #320 | Tragic 8.1% |
| Blackfeet | 0.0 /100 | #321 | Tragic 8.1% |
| Cree | 0.0 /100 | #322 | Tragic 8.1% |
| French American Indians | 0.0 /100 | #323 | Tragic 8.2% |
| Cajuns | 0.0 /100 | #324 | Tragic 8.2% |
| Natives/Alaskans | 0.0 /100 | #325 | Tragic 8.2% |
| Potawatomi | 0.0 /100 | #326 | Tragic 8.2% |
| Sioux | 0.0 /100 | #327 | Tragic 8.2% |
| Delaware | 0.0 /100 | #328 | Tragic 8.2% |
| Crow | 0.0 /100 | #329 | Tragic 8.3% |
| Osage | 0.0 /100 | #330 | Tragic 8.3% |
| Comanche | 0.0 /100 | #331 | Tragic 8.3% |
| Puget Sound Salish | 0.0 /100 | #332 | Tragic 8.3% |
Demographics Similar to Belgians by Disability Age 18 to 34
In terms of disability age 18 to 34, the demographic groups most similar to Belgians are Swiss (7.4%, a difference of 0.050%), Basque (7.4%, a difference of 0.090%), Portuguese (7.4%, a difference of 0.13%), Tsimshian (7.4%, a difference of 0.14%), and Slavic (7.4%, a difference of 0.19%).
| Demographics | Rating | Rank | Disability Age 18 to 34 |
| British | 0.2 /100 | #263 | Tragic 7.3% |
| Bermudans | 0.1 /100 | #264 | Tragic 7.3% |
| Slovenes | 0.1 /100 | #265 | Tragic 7.3% |
| German Russians | 0.1 /100 | #266 | Tragic 7.4% |
| Bangladeshis | 0.1 /100 | #267 | Tragic 7.4% |
| Portuguese | 0.1 /100 | #268 | Tragic 7.4% |
| Basques | 0.1 /100 | #269 | Tragic 7.4% |
| Belgians | 0.1 /100 | #270 | Tragic 7.4% |
| Swiss | 0.1 /100 | #271 | Tragic 7.4% |
| Tsimshian | 0.1 /100 | #272 | Tragic 7.4% |
| Slavs | 0.1 /100 | #273 | Tragic 7.4% |
| Africans | 0.1 /100 | #274 | Tragic 7.4% |
| Immigrants | Somalia | 0.1 /100 | #275 | Tragic 7.4% |
| Europeans | 0.1 /100 | #276 | Tragic 7.4% |
| Immigrants | Portugal | 0.1 /100 | #277 | Tragic 7.4% |