Native/Alaskan vs Macedonian Disability Age 18 to 34
COMPARE
Native/Alaskan
Macedonian
Disability Age 18 to 34
Disability Age 18 to 34 Comparison
Natives/Alaskans
Macedonians
8.2%
DISABILITY AGE 18 TO 34
0.0/ 100
METRIC RATING
325th/ 347
METRIC RANK
6.3%
DISABILITY AGE 18 TO 34
92.6/ 100
METRIC RATING
125th/ 347
METRIC RANK
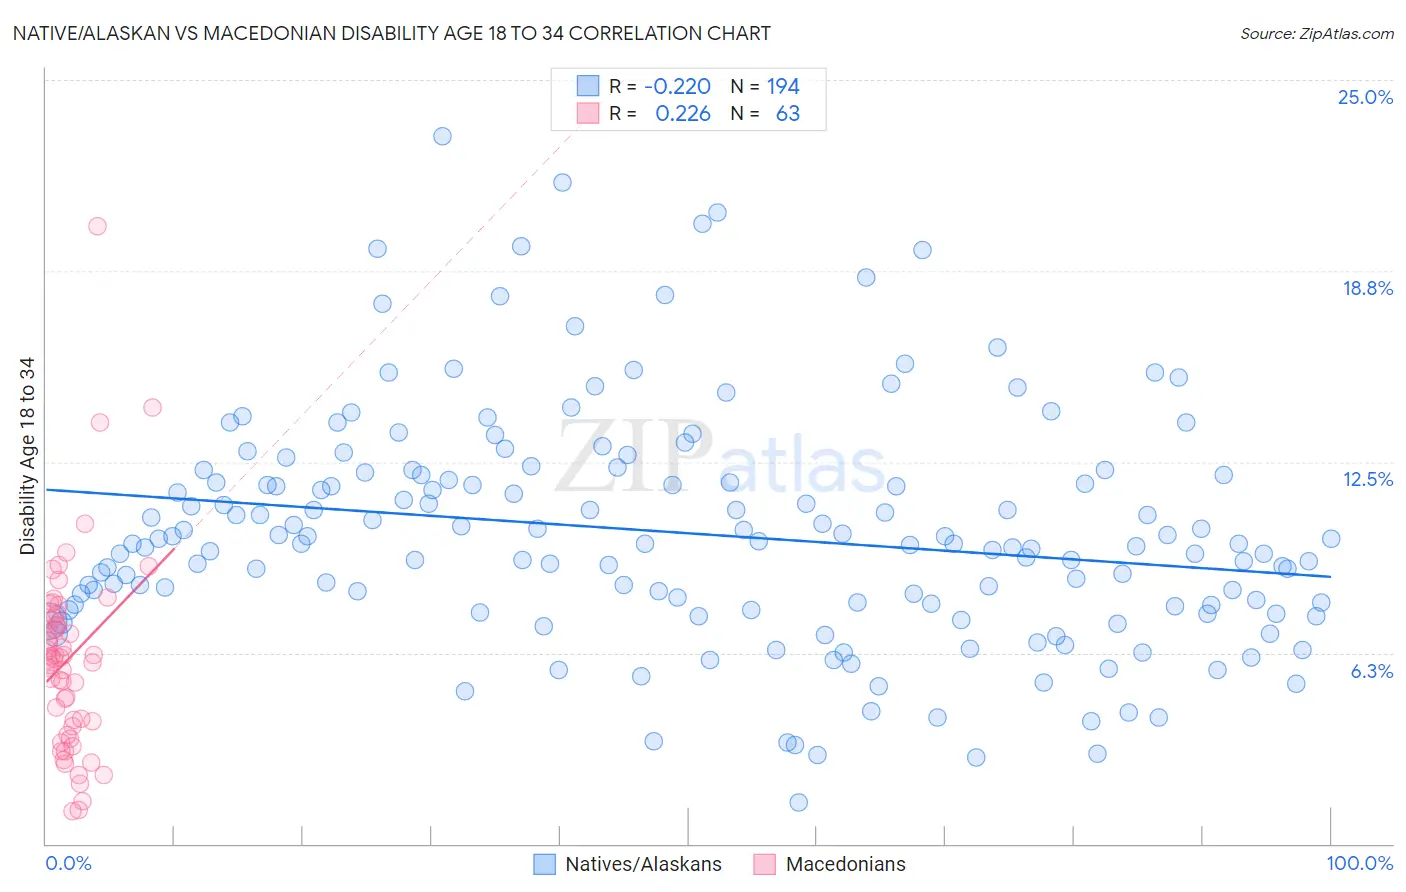
Native/Alaskan vs Macedonian Disability Age 18 to 34 Correlation Chart
The statistical analysis conducted on geographies consisting of 510,415,530 people shows a weak negative correlation between the proportion of Natives/Alaskans and percentage of population with a disability between the ages 18 and 35 in the United States with a correlation coefficient (R) of -0.220 and weighted average of 8.2%. Similarly, the statistical analysis conducted on geographies consisting of 132,591,648 people shows a weak positive correlation between the proportion of Macedonians and percentage of population with a disability between the ages 18 and 35 in the United States with a correlation coefficient (R) of 0.226 and weighted average of 6.3%, a difference of 30.2%.
Disability Age 18 to 34 Correlation Summary
| Measurement | Native/Alaskan | Macedonian |
| Minimum | 1.4% | 1.1% |
| Maximum | 23.1% | 20.2% |
| Range | 21.8% | 19.2% |
| Mean | 10.2% | 6.1% |
| Median | 9.8% | 6.1% |
| Interquartile 25% (IQ1) | 7.8% | 3.8% |
| Interquartile 75% (IQ3) | 12.1% | 7.4% |
| Interquartile Range (IQR) | 4.2% | 3.6% |
| Standard Deviation (Sample) | 3.8% | 3.2% |
| Standard Deviation (Population) | 3.8% | 3.2% |
Similar Demographics by Disability Age 18 to 34
Demographics Similar to Natives/Alaskans by Disability Age 18 to 34
In terms of disability age 18 to 34, the demographic groups most similar to Natives/Alaskans are Potawatomi (8.2%, a difference of 0.020%), Sioux (8.2%, a difference of 0.14%), Delaware (8.2%, a difference of 0.19%), Cajun (8.2%, a difference of 0.52%), and French American Indian (8.2%, a difference of 0.56%).
| Demographics | Rating | Rank | Disability Age 18 to 34 |
| French Canadians | 0.0 /100 | #318 | Tragic 8.1% |
| Aleuts | 0.0 /100 | #319 | Tragic 8.1% |
| Navajo | 0.0 /100 | #320 | Tragic 8.1% |
| Blackfeet | 0.0 /100 | #321 | Tragic 8.1% |
| Cree | 0.0 /100 | #322 | Tragic 8.1% |
| French American Indians | 0.0 /100 | #323 | Tragic 8.2% |
| Cajuns | 0.0 /100 | #324 | Tragic 8.2% |
| Natives/Alaskans | 0.0 /100 | #325 | Tragic 8.2% |
| Potawatomi | 0.0 /100 | #326 | Tragic 8.2% |
| Sioux | 0.0 /100 | #327 | Tragic 8.2% |
| Delaware | 0.0 /100 | #328 | Tragic 8.2% |
| Crow | 0.0 /100 | #329 | Tragic 8.3% |
| Osage | 0.0 /100 | #330 | Tragic 8.3% |
| Comanche | 0.0 /100 | #331 | Tragic 8.3% |
| Puget Sound Salish | 0.0 /100 | #332 | Tragic 8.3% |
Demographics Similar to Macedonians by Disability Age 18 to 34
In terms of disability age 18 to 34, the demographic groups most similar to Macedonians are Immigrants from Switzerland (6.3%, a difference of 0.030%), Immigrants from Morocco (6.3%, a difference of 0.070%), Costa Rican (6.3%, a difference of 0.080%), West Indian (6.3%, a difference of 0.16%), and Chinese (6.3%, a difference of 0.18%).
| Demographics | Rating | Rank | Disability Age 18 to 34 |
| Immigrants | Nepal | 93.7 /100 | #118 | Exceptional 6.3% |
| Chileans | 93.5 /100 | #119 | Exceptional 6.3% |
| Immigrants | Ukraine | 93.4 /100 | #120 | Exceptional 6.3% |
| Immigrants | Guatemala | 93.4 /100 | #121 | Exceptional 6.3% |
| Immigrants | Czechoslovakia | 93.3 /100 | #122 | Exceptional 6.3% |
| Costa Ricans | 92.9 /100 | #123 | Exceptional 6.3% |
| Immigrants | Morocco | 92.9 /100 | #124 | Exceptional 6.3% |
| Macedonians | 92.6 /100 | #125 | Exceptional 6.3% |
| Immigrants | Switzerland | 92.5 /100 | #126 | Exceptional 6.3% |
| West Indians | 92.0 /100 | #127 | Exceptional 6.3% |
| Chinese | 91.9 /100 | #128 | Exceptional 6.3% |
| Immigrants | Italy | 90.5 /100 | #129 | Exceptional 6.3% |
| Immigrants | Dominica | 90.5 /100 | #130 | Exceptional 6.3% |
| Immigrants | Saudi Arabia | 90.4 /100 | #131 | Exceptional 6.3% |
| Guatemalans | 89.6 /100 | #132 | Excellent 6.4% |