Native/Alaskan vs Nigerian No Schooling Completed
COMPARE
Native/Alaskan
Nigerian
No Schooling Completed
No Schooling Completed Comparison
Natives/Alaskans
Nigerians
2.2%
NO SCHOOLING COMPLETED
10.0/ 100
METRIC RATING
210th/ 347
METRIC RANK
2.3%
NO SCHOOLING COMPLETED
2.6/ 100
METRIC RATING
234th/ 347
METRIC RANK
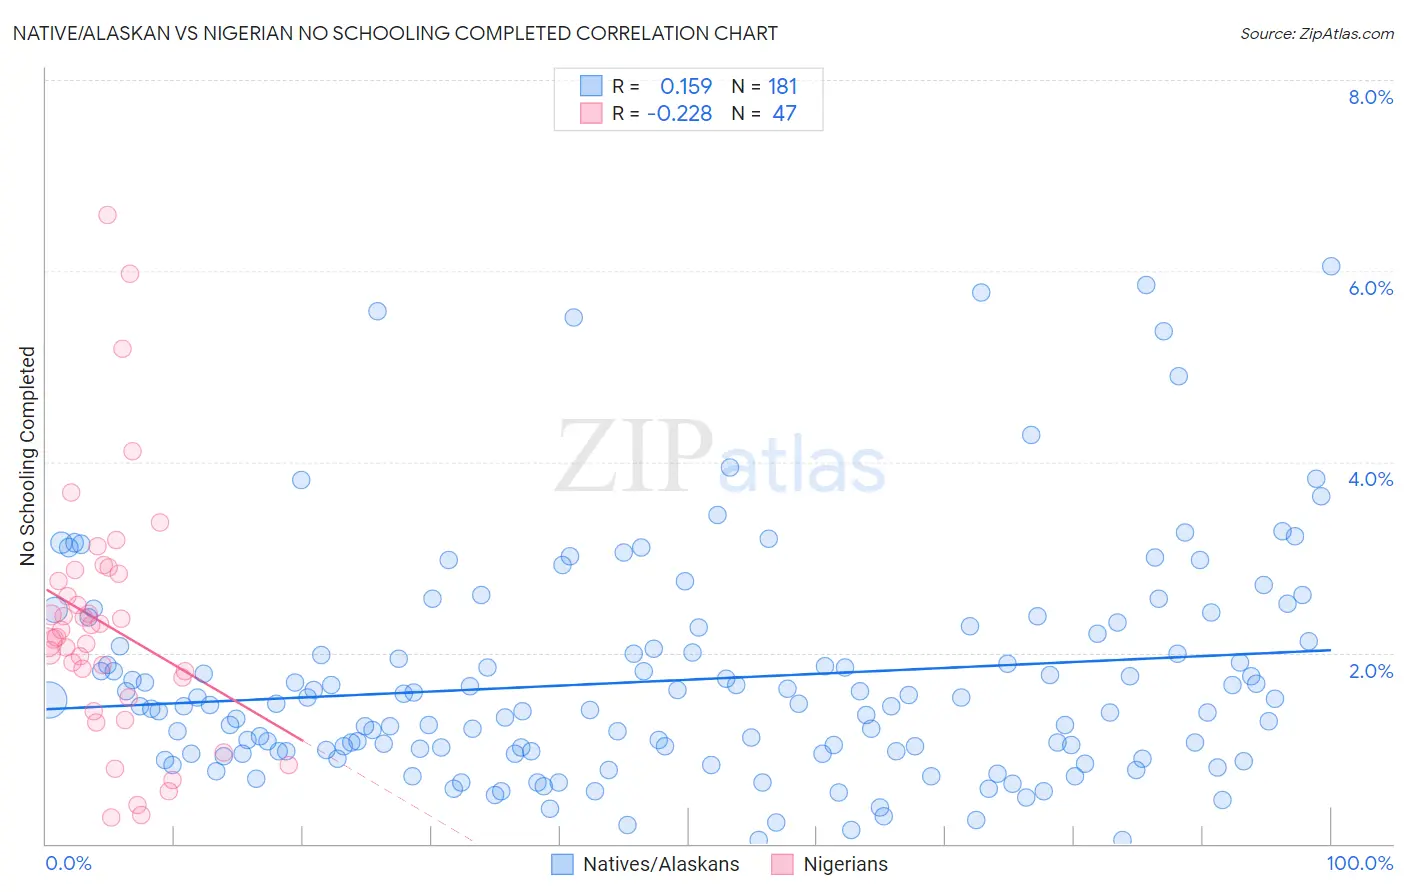
Native/Alaskan vs Nigerian No Schooling Completed Correlation Chart
The statistical analysis conducted on geographies consisting of 503,675,211 people shows a poor positive correlation between the proportion of Natives/Alaskans and percentage of population with no schooling in the United States with a correlation coefficient (R) of 0.159 and weighted average of 2.2%. Similarly, the statistical analysis conducted on geographies consisting of 330,931,802 people shows a weak negative correlation between the proportion of Nigerians and percentage of population with no schooling in the United States with a correlation coefficient (R) of -0.228 and weighted average of 2.3%, a difference of 4.4%.
No Schooling Completed Correlation Summary
| Measurement | Native/Alaskan | Nigerian |
| Minimum | 0.041% | 0.27% |
| Maximum | 6.0% | 6.6% |
| Range | 6.0% | 6.3% |
| Mean | 1.7% | 2.3% |
| Median | 1.4% | 2.2% |
| Interquartile 25% (IQ1) | 0.96% | 1.5% |
| Interquartile 75% (IQ3) | 2.1% | 2.8% |
| Interquartile Range (IQR) | 1.1% | 1.3% |
| Standard Deviation (Sample) | 1.2% | 1.3% |
| Standard Deviation (Population) | 1.2% | 1.3% |
Similar Demographics by No Schooling Completed
Demographics Similar to Natives/Alaskans by No Schooling Completed
In terms of no schooling completed, the demographic groups most similar to Natives/Alaskans are Immigrants from Oceania (2.2%, a difference of 0.070%), South American Indian (2.2%, a difference of 0.33%), Uruguayan (2.2%, a difference of 0.33%), Immigrants from Panama (2.3%, a difference of 0.45%), and Immigrants from Morocco (2.3%, a difference of 0.46%).
| Demographics | Rating | Rank | No Schooling Completed |
| Laotians | 13.3 /100 | #203 | Poor 2.2% |
| Hopi | 12.9 /100 | #204 | Poor 2.2% |
| Immigrants | Bahamas | 11.6 /100 | #205 | Poor 2.2% |
| Bahamians | 11.6 /100 | #206 | Poor 2.2% |
| South American Indians | 11.0 /100 | #207 | Poor 2.2% |
| Uruguayans | 11.0 /100 | #208 | Poor 2.2% |
| Immigrants | Oceania | 10.2 /100 | #209 | Poor 2.2% |
| Natives/Alaskans | 10.0 /100 | #210 | Tragic 2.2% |
| Immigrants | Panama | 8.8 /100 | #211 | Tragic 2.3% |
| Immigrants | Morocco | 8.7 /100 | #212 | Tragic 2.3% |
| Ute | 8.2 /100 | #213 | Tragic 2.3% |
| Samoans | 8.2 /100 | #214 | Tragic 2.3% |
| Immigrants | Zaire | 7.2 /100 | #215 | Tragic 2.3% |
| Tongans | 6.8 /100 | #216 | Tragic 2.3% |
| Immigrants | Syria | 6.6 /100 | #217 | Tragic 2.3% |
Demographics Similar to Nigerians by No Schooling Completed
In terms of no schooling completed, the demographic groups most similar to Nigerians are Immigrants from Western Asia (2.3%, a difference of 0.020%), Immigrants from Malaysia (2.3%, a difference of 0.25%), Iraqi (2.4%, a difference of 0.56%), Colombian (2.3%, a difference of 0.61%), and Immigrants from Eastern Asia (2.4%, a difference of 0.76%).
| Demographics | Rating | Rank | No Schooling Completed |
| Immigrants | Uganda | 4.0 /100 | #227 | Tragic 2.3% |
| U.S. Virgin Islanders | 3.7 /100 | #228 | Tragic 2.3% |
| Immigrants | Pakistan | 3.6 /100 | #229 | Tragic 2.3% |
| Puerto Ricans | 3.4 /100 | #230 | Tragic 2.3% |
| Immigrants | Uruguay | 3.4 /100 | #231 | Tragic 2.3% |
| Colombians | 3.2 /100 | #232 | Tragic 2.3% |
| Immigrants | Malaysia | 2.8 /100 | #233 | Tragic 2.3% |
| Nigerians | 2.6 /100 | #234 | Tragic 2.3% |
| Immigrants | Western Asia | 2.6 /100 | #235 | Tragic 2.3% |
| Iraqis | 2.2 /100 | #236 | Tragic 2.4% |
| Immigrants | Eastern Asia | 2.0 /100 | #237 | Tragic 2.4% |
| Paiute | 1.9 /100 | #238 | Tragic 2.4% |
| Liberians | 1.8 /100 | #239 | Tragic 2.4% |
| Immigrants | Senegal | 1.7 /100 | #240 | Tragic 2.4% |
| Koreans | 1.7 /100 | #241 | Tragic 2.4% |