Native/Alaskan vs Menominee Disability Age 18 to 34
COMPARE
Native/Alaskan
Menominee
Disability Age 18 to 34
Disability Age 18 to 34 Comparison
Natives/Alaskans
Menominee
8.2%
DISABILITY AGE 18 TO 34
0.0/ 100
METRIC RATING
325th/ 347
METRIC RANK
7.8%
DISABILITY AGE 18 TO 34
0.0/ 100
METRIC RATING
305th/ 347
METRIC RANK
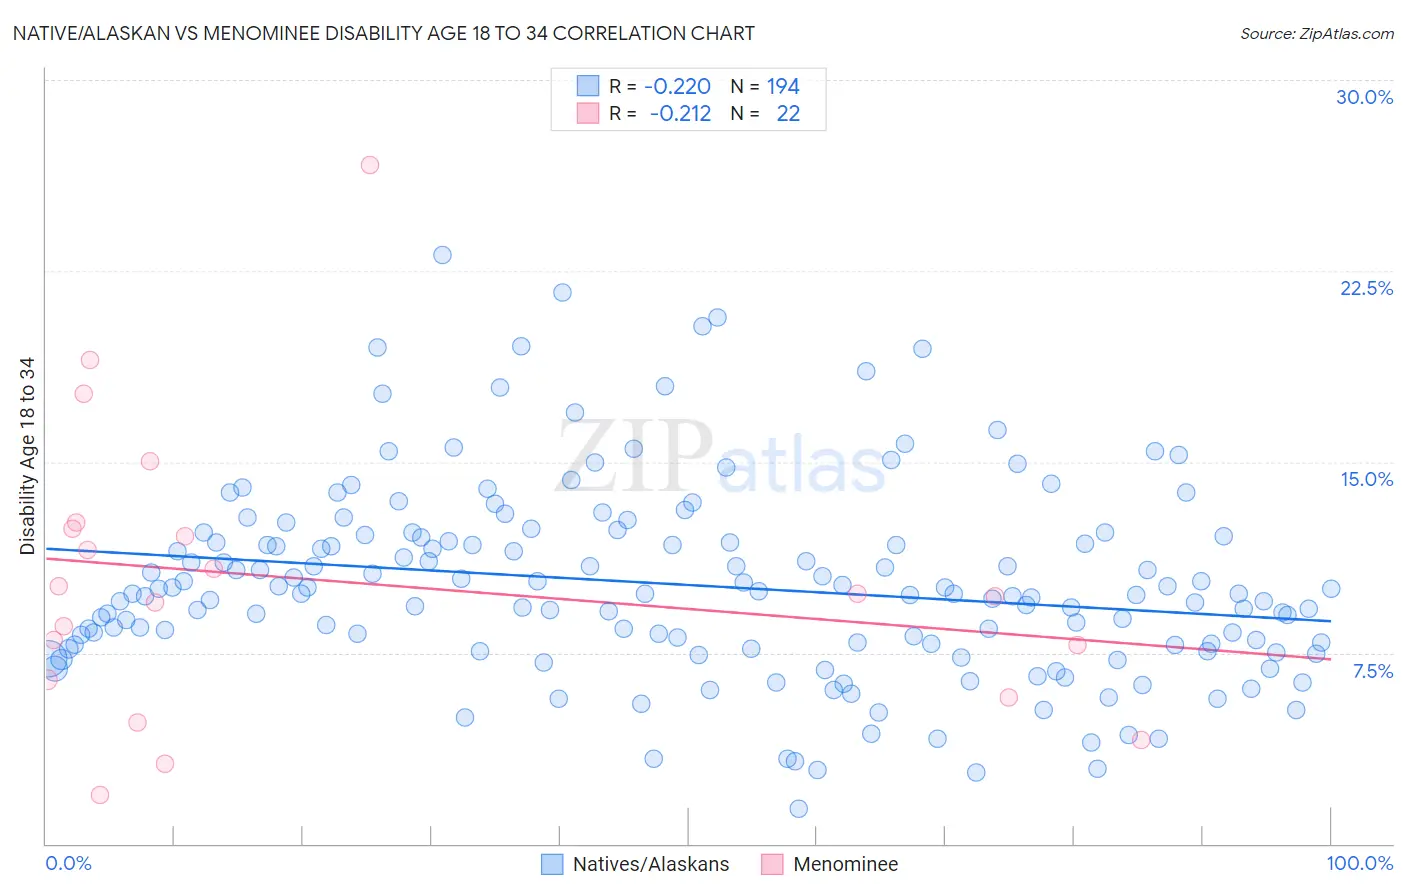
Native/Alaskan vs Menominee Disability Age 18 to 34 Correlation Chart
The statistical analysis conducted on geographies consisting of 510,415,530 people shows a weak negative correlation between the proportion of Natives/Alaskans and percentage of population with a disability between the ages 18 and 35 in the United States with a correlation coefficient (R) of -0.220 and weighted average of 8.2%. Similarly, the statistical analysis conducted on geographies consisting of 45,742,015 people shows a weak negative correlation between the proportion of Menominee and percentage of population with a disability between the ages 18 and 35 in the United States with a correlation coefficient (R) of -0.212 and weighted average of 7.8%, a difference of 5.6%.
Disability Age 18 to 34 Correlation Summary
| Measurement | Native/Alaskan | Menominee |
| Minimum | 1.4% | 1.9% |
| Maximum | 23.1% | 26.7% |
| Range | 21.8% | 24.8% |
| Mean | 10.2% | 10.3% |
| Median | 9.8% | 9.8% |
| Interquartile 25% (IQ1) | 7.8% | 6.4% |
| Interquartile 75% (IQ3) | 12.1% | 12.4% |
| Interquartile Range (IQR) | 4.2% | 6.0% |
| Standard Deviation (Sample) | 3.8% | 5.7% |
| Standard Deviation (Population) | 3.8% | 5.5% |
Demographics Similar to Natives/Alaskans and Menominee by Disability Age 18 to 34
In terms of disability age 18 to 34, the demographic groups most similar to Natives/Alaskans are Cajun (8.2%, a difference of 0.52%), French American Indian (8.2%, a difference of 0.56%), Cree (8.1%, a difference of 1.1%), Blackfeet (8.1%, a difference of 1.1%), and Navajo (8.1%, a difference of 1.5%). Similarly, the demographic groups most similar to Menominee are English (7.8%, a difference of 0.080%), Scotch-Irish (7.8%, a difference of 0.34%), Pennsylvania German (7.8%, a difference of 0.37%), Alaska Native (7.8%, a difference of 0.38%), and Finnish (7.8%, a difference of 0.44%).
| Demographics | Rating | Rank | Disability Age 18 to 34 |
| Menominee | 0.0 /100 | #305 | Tragic 7.8% |
| English | 0.0 /100 | #306 | Tragic 7.8% |
| Scotch-Irish | 0.0 /100 | #307 | Tragic 7.8% |
| Pennsylvania Germans | 0.0 /100 | #308 | Tragic 7.8% |
| Alaska Natives | 0.0 /100 | #309 | Tragic 7.8% |
| Finns | 0.0 /100 | #310 | Tragic 7.8% |
| French | 0.0 /100 | #311 | Tragic 7.9% |
| Spanish Americans | 0.0 /100 | #312 | Tragic 7.9% |
| Iroquois | 0.0 /100 | #313 | Tragic 7.9% |
| Colville | 0.0 /100 | #314 | Tragic 7.9% |
| Americans | 0.0 /100 | #315 | Tragic 8.0% |
| Puerto Ricans | 0.0 /100 | #316 | Tragic 8.0% |
| Hmong | 0.0 /100 | #317 | Tragic 8.1% |
| French Canadians | 0.0 /100 | #318 | Tragic 8.1% |
| Aleuts | 0.0 /100 | #319 | Tragic 8.1% |
| Navajo | 0.0 /100 | #320 | Tragic 8.1% |
| Blackfeet | 0.0 /100 | #321 | Tragic 8.1% |
| Cree | 0.0 /100 | #322 | Tragic 8.1% |
| French American Indians | 0.0 /100 | #323 | Tragic 8.2% |
| Cajuns | 0.0 /100 | #324 | Tragic 8.2% |
| Natives/Alaskans | 0.0 /100 | #325 | Tragic 8.2% |