Zimbabwean vs Nigerian Disability Age 18 to 34
COMPARE
Zimbabwean
Nigerian
Disability Age 18 to 34
Disability Age 18 to 34 Comparison
Zimbabweans
Nigerians
6.5%
DISABILITY AGE 18 TO 34
74.7/ 100
METRIC RATING
158th/ 347
METRIC RANK
6.6%
DISABILITY AGE 18 TO 34
43.7/ 100
METRIC RATING
178th/ 347
METRIC RANK
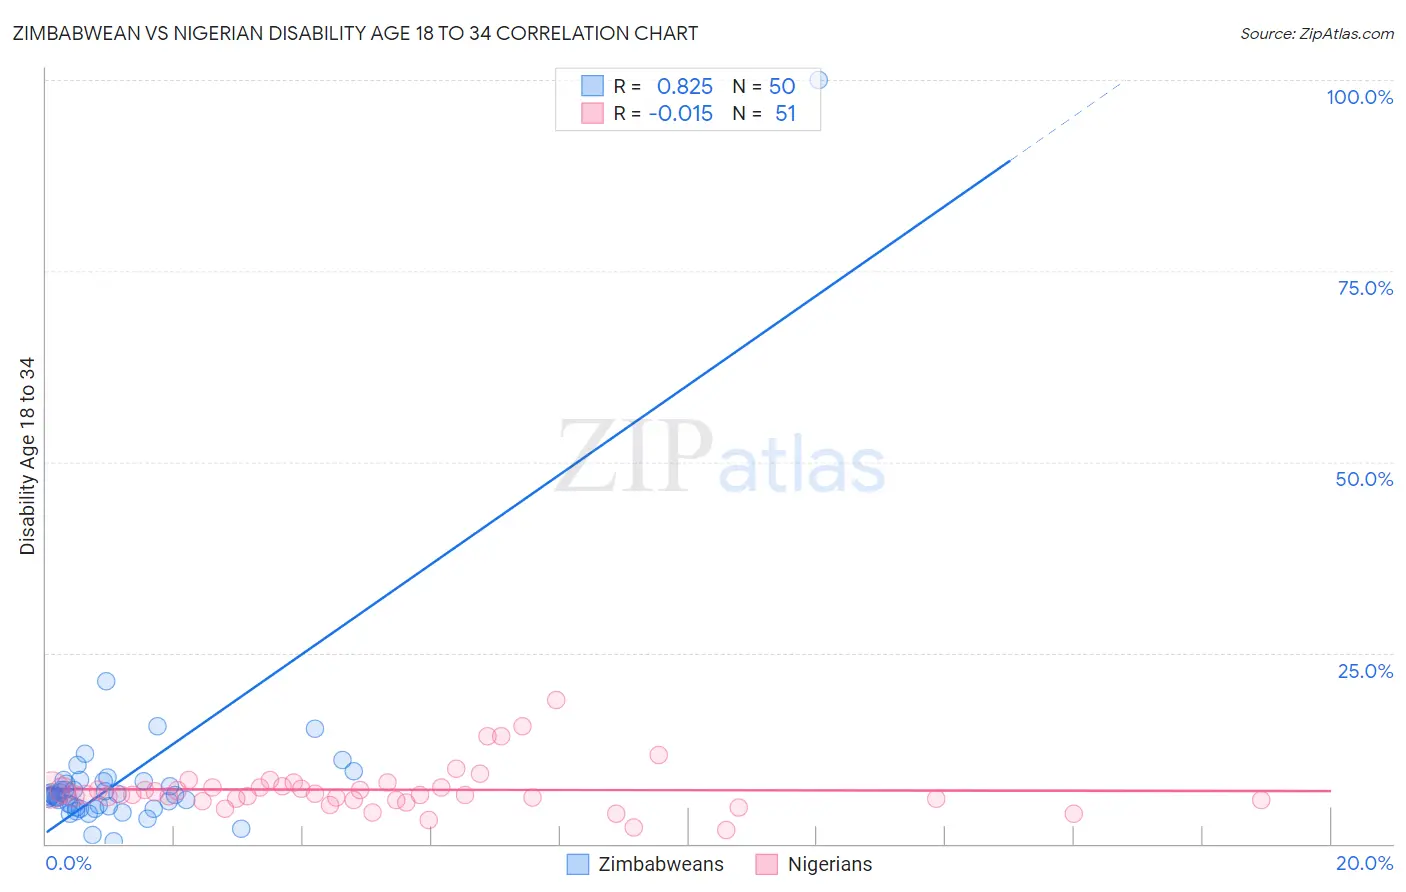
Zimbabwean vs Nigerian Disability Age 18 to 34 Correlation Chart
The statistical analysis conducted on geographies consisting of 69,205,291 people shows a very strong positive correlation between the proportion of Zimbabweans and percentage of population with a disability between the ages 18 and 35 in the United States with a correlation coefficient (R) of 0.825 and weighted average of 6.5%. Similarly, the statistical analysis conducted on geographies consisting of 332,463,027 people shows no correlation between the proportion of Nigerians and percentage of population with a disability between the ages 18 and 35 in the United States with a correlation coefficient (R) of -0.015 and weighted average of 6.6%, a difference of 2.4%.
Disability Age 18 to 34 Correlation Summary
| Measurement | Zimbabwean | Nigerian |
| Minimum | 0.28% | 1.9% |
| Maximum | 100.0% | 18.8% |
| Range | 99.7% | 17.0% |
| Mean | 8.7% | 7.1% |
| Median | 6.3% | 6.4% |
| Interquartile 25% (IQ1) | 5.0% | 5.8% |
| Interquartile 75% (IQ3) | 8.1% | 7.4% |
| Interquartile Range (IQR) | 3.1% | 1.7% |
| Standard Deviation (Sample) | 13.6% | 3.1% |
| Standard Deviation (Population) | 13.5% | 3.1% |
Demographics Similar to Zimbabweans and Nigerians by Disability Age 18 to 34
In terms of disability age 18 to 34, the demographic groups most similar to Zimbabweans are Dominican (6.5%, a difference of 0.11%), Immigrants from Southern Europe (6.5%, a difference of 0.20%), Arab (6.5%, a difference of 0.22%), South African (6.5%, a difference of 0.27%), and Immigrants from Denmark (6.5%, a difference of 0.27%). Similarly, the demographic groups most similar to Nigerians are Syrian (6.6%, a difference of 0.040%), Immigrants from Africa (6.6%, a difference of 0.15%), Immigrants from Cambodia (6.6%, a difference of 0.19%), Native Hawaiian (6.6%, a difference of 0.44%), and Immigrants from Mexico (6.6%, a difference of 0.73%).
| Demographics | Rating | Rank | Disability Age 18 to 34 |
| Zimbabweans | 74.7 /100 | #158 | Good 6.5% |
| Dominicans | 73.6 /100 | #159 | Good 6.5% |
| Immigrants | Southern Europe | 72.5 /100 | #160 | Good 6.5% |
| Arabs | 72.3 /100 | #161 | Good 6.5% |
| South Africans | 71.7 /100 | #162 | Good 6.5% |
| Immigrants | Denmark | 71.7 /100 | #163 | Good 6.5% |
| Immigrants | Nigeria | 70.4 /100 | #164 | Good 6.5% |
| Immigrants | Hungary | 69.6 /100 | #165 | Good 6.5% |
| Eastern Europeans | 65.1 /100 | #166 | Good 6.5% |
| Immigrants | Northern Europe | 64.1 /100 | #167 | Good 6.5% |
| Immigrants | Moldova | 63.1 /100 | #168 | Good 6.5% |
| Russians | 60.2 /100 | #169 | Good 6.5% |
| Immigrants | Bahamas | 57.9 /100 | #170 | Average 6.6% |
| Bahamians | 55.5 /100 | #171 | Average 6.6% |
| Ghanaians | 54.7 /100 | #172 | Average 6.6% |
| Immigrants | Mexico | 54.1 /100 | #173 | Average 6.6% |
| Native Hawaiians | 50.0 /100 | #174 | Average 6.6% |
| Immigrants | Cambodia | 46.5 /100 | #175 | Average 6.6% |
| Immigrants | Africa | 45.9 /100 | #176 | Average 6.6% |
| Syrians | 44.3 /100 | #177 | Average 6.6% |
| Nigerians | 43.7 /100 | #178 | Average 6.6% |