Native/Alaskan vs Immigrants from Bulgaria Self-Care Disability
COMPARE
Native/Alaskan
Immigrants from Bulgaria
Self-Care Disability
Self-Care Disability Comparison
Natives/Alaskans
Immigrants from Bulgaria
2.8%
SELF-CARE DISABILITY
0.0/ 100
METRIC RATING
307th/ 347
METRIC RANK
2.3%
SELF-CARE DISABILITY
99.8/ 100
METRIC RATING
39th/ 347
METRIC RANK
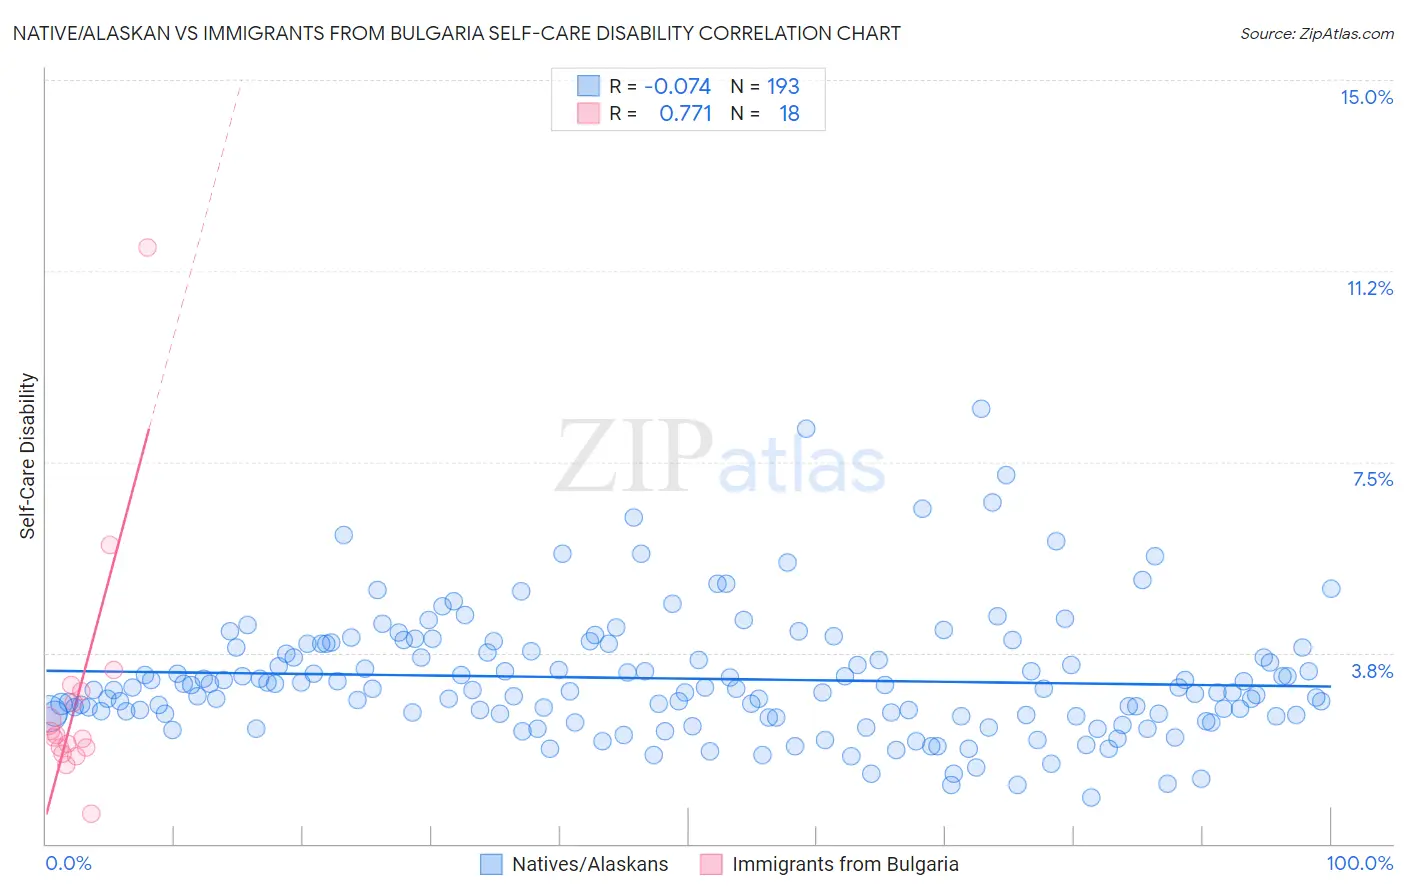
Native/Alaskan vs Immigrants from Bulgaria Self-Care Disability Correlation Chart
The statistical analysis conducted on geographies consisting of 511,798,429 people shows a slight negative correlation between the proportion of Natives/Alaskans and percentage of population with self-care disability in the United States with a correlation coefficient (R) of -0.074 and weighted average of 2.8%. Similarly, the statistical analysis conducted on geographies consisting of 172,509,254 people shows a strong positive correlation between the proportion of Immigrants from Bulgaria and percentage of population with self-care disability in the United States with a correlation coefficient (R) of 0.771 and weighted average of 2.3%, a difference of 23.2%.
Self-Care Disability Correlation Summary
| Measurement | Native/Alaskan | Immigrants from Bulgaria |
| Minimum | 0.90% | 0.60% |
| Maximum | 8.5% | 11.7% |
| Range | 7.7% | 11.1% |
| Mean | 3.2% | 2.9% |
| Median | 3.0% | 2.1% |
| Interquartile 25% (IQ1) | 2.5% | 1.9% |
| Interquartile 75% (IQ3) | 3.9% | 3.0% |
| Interquartile Range (IQR) | 1.3% | 1.1% |
| Standard Deviation (Sample) | 1.2% | 2.4% |
| Standard Deviation (Population) | 1.2% | 2.4% |
Similar Demographics by Self-Care Disability
Demographics Similar to Natives/Alaskans by Self-Care Disability
In terms of self-care disability, the demographic groups most similar to Natives/Alaskans are Aleut (2.8%, a difference of 0.070%), Immigrants from Grenada (2.8%, a difference of 0.30%), Bangladeshi (2.8%, a difference of 0.45%), Immigrants from West Indies (2.8%, a difference of 0.47%), and Cree (2.8%, a difference of 0.52%).
| Demographics | Rating | Rank | Self-Care Disability |
| Immigrants | Fiji | 0.0 /100 | #300 | Tragic 2.8% |
| Pima | 0.0 /100 | #301 | Tragic 2.8% |
| Immigrants | St. Vincent and the Grenadines | 0.0 /100 | #302 | Tragic 2.8% |
| Immigrants | Belize | 0.0 /100 | #303 | Tragic 2.8% |
| Cree | 0.0 /100 | #304 | Tragic 2.8% |
| Immigrants | West Indies | 0.0 /100 | #305 | Tragic 2.8% |
| Aleuts | 0.0 /100 | #306 | Tragic 2.8% |
| Natives/Alaskans | 0.0 /100 | #307 | Tragic 2.8% |
| Immigrants | Grenada | 0.0 /100 | #308 | Tragic 2.8% |
| Bangladeshis | 0.0 /100 | #309 | Tragic 2.8% |
| British West Indians | 0.0 /100 | #310 | Tragic 2.8% |
| Puget Sound Salish | 0.0 /100 | #311 | Tragic 2.8% |
| Immigrants | Caribbean | 0.0 /100 | #312 | Tragic 2.8% |
| Spanish Americans | 0.0 /100 | #313 | Tragic 2.8% |
| Creek | 0.0 /100 | #314 | Tragic 2.8% |
Demographics Similar to Immigrants from Bulgaria by Self-Care Disability
In terms of self-care disability, the demographic groups most similar to Immigrants from Bulgaria are Iranian (2.3%, a difference of 0.040%), Immigrants from Eastern Africa (2.3%, a difference of 0.10%), Immigrants from Sudan (2.3%, a difference of 0.11%), Immigrants from Uganda (2.3%, a difference of 0.21%), and Immigrants from Sweden (2.3%, a difference of 0.23%).
| Demographics | Rating | Rank | Self-Care Disability |
| Burmese | 99.9 /100 | #32 | Exceptional 2.3% |
| Immigrants | Korea | 99.9 /100 | #33 | Exceptional 2.3% |
| Immigrants | Turkey | 99.9 /100 | #34 | Exceptional 2.3% |
| Immigrants | Australia | 99.9 /100 | #35 | Exceptional 2.3% |
| Immigrants | Lithuania | 99.9 /100 | #36 | Exceptional 2.3% |
| Immigrants | Sweden | 99.9 /100 | #37 | Exceptional 2.3% |
| Immigrants | Eastern Africa | 99.9 /100 | #38 | Exceptional 2.3% |
| Immigrants | Bulgaria | 99.8 /100 | #39 | Exceptional 2.3% |
| Iranians | 99.8 /100 | #40 | Exceptional 2.3% |
| Immigrants | Sudan | 99.8 /100 | #41 | Exceptional 2.3% |
| Immigrants | Uganda | 99.8 /100 | #42 | Exceptional 2.3% |
| Immigrants | Pakistan | 99.8 /100 | #43 | Exceptional 2.3% |
| Immigrants | South Africa | 99.8 /100 | #44 | Exceptional 2.3% |
| Norwegians | 99.8 /100 | #45 | Exceptional 2.3% |
| Czechs | 99.8 /100 | #46 | Exceptional 2.3% |