Native Hawaiian vs Immigrants from Zaire Male Disability
COMPARE
Native Hawaiian
Immigrants from Zaire
Male Disability
Male Disability Comparison
Native Hawaiians
Immigrants from Zaire
12.5%
MALE DISABILITY
0.0/ 100
METRIC RATING
273rd/ 347
METRIC RANK
11.4%
MALE DISABILITY
27.6/ 100
METRIC RATING
186th/ 347
METRIC RANK
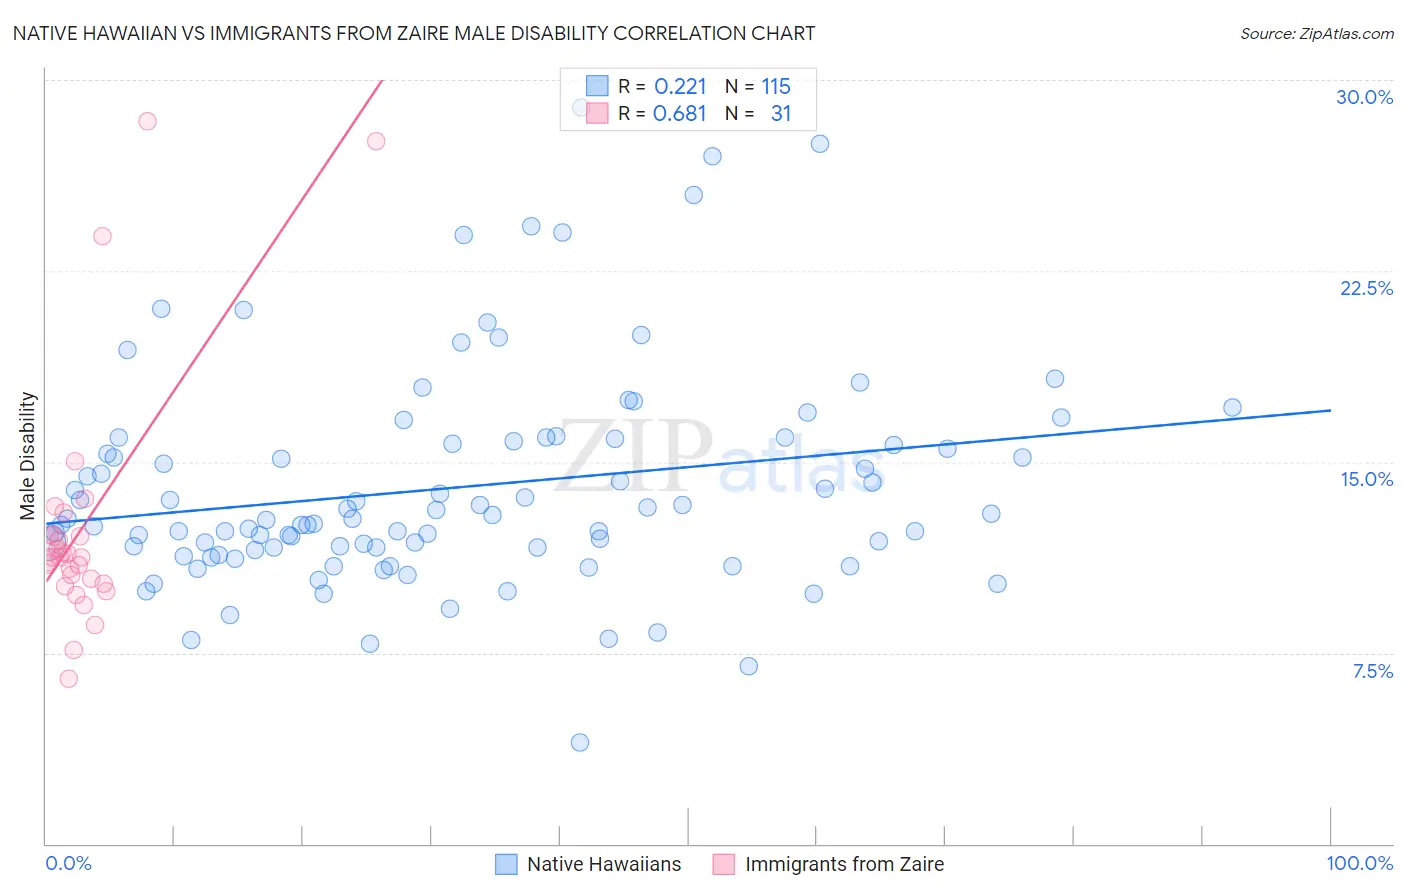
Native Hawaiian vs Immigrants from Zaire Male Disability Correlation Chart
The statistical analysis conducted on geographies consisting of 332,022,677 people shows a weak positive correlation between the proportion of Native Hawaiians and percentage of males with a disability in the United States with a correlation coefficient (R) of 0.221 and weighted average of 12.5%. Similarly, the statistical analysis conducted on geographies consisting of 107,255,080 people shows a significant positive correlation between the proportion of Immigrants from Zaire and percentage of males with a disability in the United States with a correlation coefficient (R) of 0.681 and weighted average of 11.4%, a difference of 9.8%.
Male Disability Correlation Summary
| Measurement | Native Hawaiian | Immigrants from Zaire |
| Minimum | 4.0% | 6.5% |
| Maximum | 28.9% | 28.4% |
| Range | 25.0% | 21.9% |
| Mean | 14.0% | 12.5% |
| Median | 12.8% | 11.2% |
| Interquartile 25% (IQ1) | 11.6% | 10.2% |
| Interquartile 75% (IQ3) | 15.8% | 12.1% |
| Interquartile Range (IQR) | 4.2% | 1.9% |
| Standard Deviation (Sample) | 4.3% | 5.0% |
| Standard Deviation (Population) | 4.3% | 4.9% |
Similar Demographics by Male Disability
Demographics Similar to Native Hawaiians by Male Disability
In terms of male disability, the demographic groups most similar to Native Hawaiians are Hmong (12.5%, a difference of 0.060%), Hopi (12.5%, a difference of 0.33%), Fijian (12.6%, a difference of 0.68%), African (12.6%, a difference of 0.74%), and Finnish (12.6%, a difference of 1.1%).
| Demographics | Rating | Rank | Male Disability |
| Hawaiians | 0.1 /100 | #266 | Tragic 12.3% |
| Immigrants | Germany | 0.1 /100 | #267 | Tragic 12.3% |
| Portuguese | 0.1 /100 | #268 | Tragic 12.3% |
| Czechoslovakians | 0.1 /100 | #269 | Tragic 12.3% |
| Spaniards | 0.1 /100 | #270 | Tragic 12.3% |
| Scandinavians | 0.1 /100 | #271 | Tragic 12.3% |
| Hmong | 0.0 /100 | #272 | Tragic 12.5% |
| Native Hawaiians | 0.0 /100 | #273 | Tragic 12.5% |
| Hopi | 0.0 /100 | #274 | Tragic 12.5% |
| Fijians | 0.0 /100 | #275 | Tragic 12.6% |
| Africans | 0.0 /100 | #276 | Tragic 12.6% |
| Finns | 0.0 /100 | #277 | Tragic 12.6% |
| Central American Indians | 0.0 /100 | #278 | Tragic 12.7% |
| Slovaks | 0.0 /100 | #279 | Tragic 12.7% |
| Dutch | 0.0 /100 | #280 | Tragic 12.7% |
Demographics Similar to Immigrants from Zaire by Male Disability
In terms of male disability, the demographic groups most similar to Immigrants from Zaire are Immigrants from Austria (11.4%, a difference of 0.020%), Estonian (11.4%, a difference of 0.060%), Immigrants from Netherlands (11.4%, a difference of 0.12%), Immigrants from Bosnia and Herzegovina (11.4%, a difference of 0.16%), and Pakistani (11.3%, a difference of 0.18%).
| Demographics | Rating | Rank | Male Disability |
| Immigrants | Caribbean | 41.4 /100 | #179 | Average 11.3% |
| Hondurans | 41.1 /100 | #180 | Average 11.3% |
| Immigrants | Senegal | 34.4 /100 | #181 | Fair 11.3% |
| Immigrants | Belize | 33.7 /100 | #182 | Fair 11.3% |
| Immigrants | Central America | 32.9 /100 | #183 | Fair 11.3% |
| Iraqis | 30.5 /100 | #184 | Fair 11.3% |
| Pakistanis | 30.3 /100 | #185 | Fair 11.3% |
| Immigrants | Zaire | 27.6 /100 | #186 | Fair 11.4% |
| Immigrants | Austria | 27.3 /100 | #187 | Fair 11.4% |
| Estonians | 26.8 /100 | #188 | Fair 11.4% |
| Immigrants | Netherlands | 25.9 /100 | #189 | Fair 11.4% |
| Immigrants | Bosnia and Herzegovina | 25.4 /100 | #190 | Fair 11.4% |
| Senegalese | 23.2 /100 | #191 | Fair 11.4% |
| Assyrians/Chaldeans/Syriacs | 23.2 /100 | #192 | Fair 11.4% |
| Greeks | 22.2 /100 | #193 | Fair 11.4% |