Native Hawaiian vs Immigrants from Cambodia Male Disability
COMPARE
Native Hawaiian
Immigrants from Cambodia
Male Disability
Male Disability Comparison
Native Hawaiians
Immigrants from Cambodia
12.5%
MALE DISABILITY
0.0/ 100
METRIC RATING
273rd/ 347
METRIC RANK
11.5%
MALE DISABILITY
10.8/ 100
METRIC RATING
204th/ 347
METRIC RANK
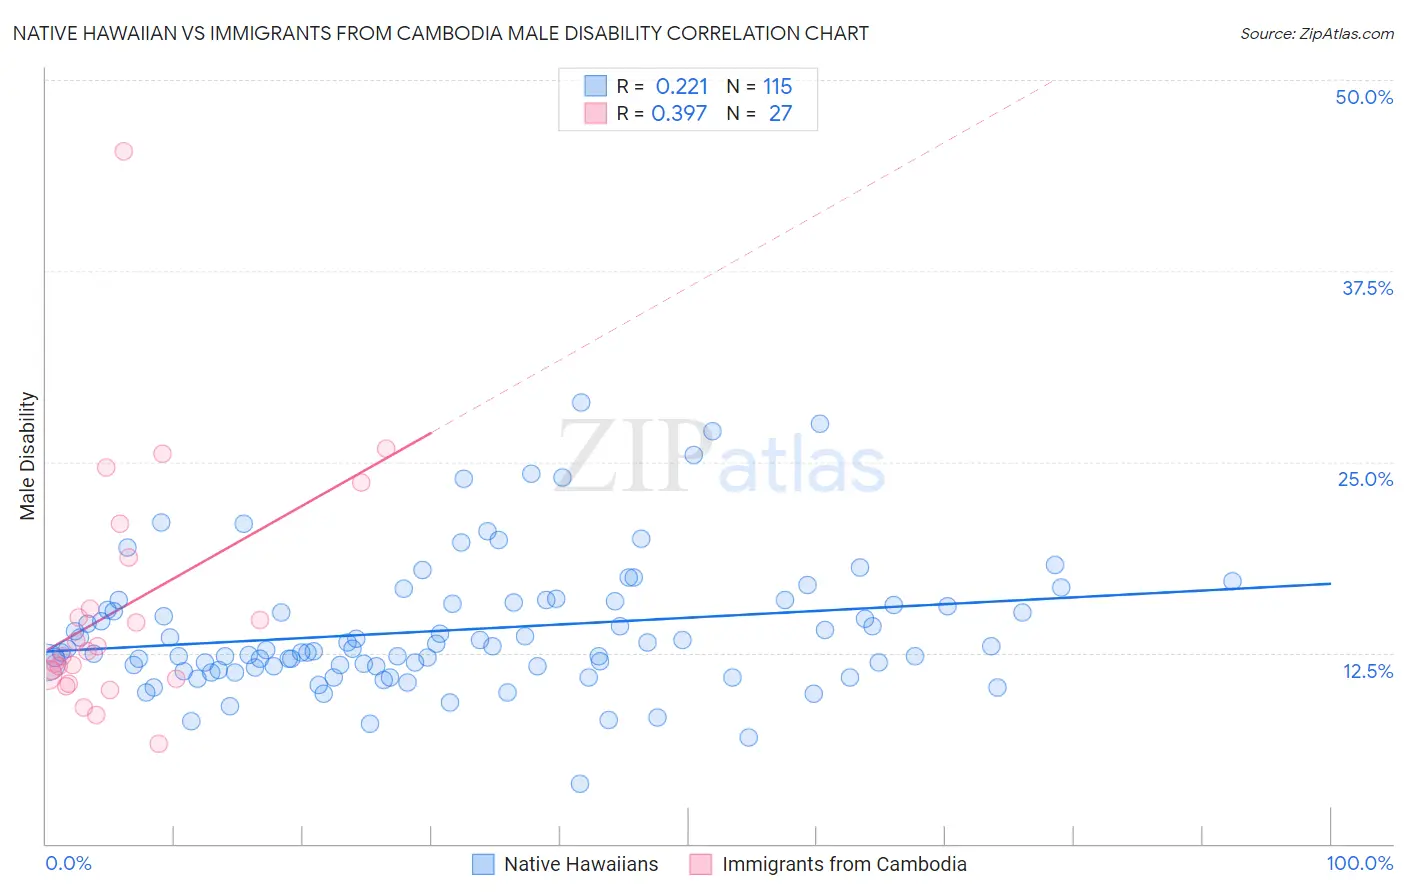
Native Hawaiian vs Immigrants from Cambodia Male Disability Correlation Chart
The statistical analysis conducted on geographies consisting of 332,022,677 people shows a weak positive correlation between the proportion of Native Hawaiians and percentage of males with a disability in the United States with a correlation coefficient (R) of 0.221 and weighted average of 12.5%. Similarly, the statistical analysis conducted on geographies consisting of 205,155,985 people shows a mild positive correlation between the proportion of Immigrants from Cambodia and percentage of males with a disability in the United States with a correlation coefficient (R) of 0.397 and weighted average of 11.5%, a difference of 8.1%.
Male Disability Correlation Summary
| Measurement | Native Hawaiian | Immigrants from Cambodia |
| Minimum | 4.0% | 6.5% |
| Maximum | 28.9% | 45.3% |
| Range | 25.0% | 38.8% |
| Mean | 14.0% | 15.5% |
| Median | 12.8% | 12.6% |
| Interquartile 25% (IQ1) | 11.6% | 10.8% |
| Interquartile 75% (IQ3) | 15.8% | 18.7% |
| Interquartile Range (IQR) | 4.2% | 7.9% |
| Standard Deviation (Sample) | 4.3% | 8.0% |
| Standard Deviation (Population) | 4.3% | 7.9% |
Similar Demographics by Male Disability
Demographics Similar to Native Hawaiians by Male Disability
In terms of male disability, the demographic groups most similar to Native Hawaiians are Hmong (12.5%, a difference of 0.060%), Hopi (12.5%, a difference of 0.33%), Fijian (12.6%, a difference of 0.68%), African (12.6%, a difference of 0.74%), and Finnish (12.6%, a difference of 1.1%).
| Demographics | Rating | Rank | Male Disability |
| Hawaiians | 0.1 /100 | #266 | Tragic 12.3% |
| Immigrants | Germany | 0.1 /100 | #267 | Tragic 12.3% |
| Portuguese | 0.1 /100 | #268 | Tragic 12.3% |
| Czechoslovakians | 0.1 /100 | #269 | Tragic 12.3% |
| Spaniards | 0.1 /100 | #270 | Tragic 12.3% |
| Scandinavians | 0.1 /100 | #271 | Tragic 12.3% |
| Hmong | 0.0 /100 | #272 | Tragic 12.5% |
| Native Hawaiians | 0.0 /100 | #273 | Tragic 12.5% |
| Hopi | 0.0 /100 | #274 | Tragic 12.5% |
| Fijians | 0.0 /100 | #275 | Tragic 12.6% |
| Africans | 0.0 /100 | #276 | Tragic 12.6% |
| Finns | 0.0 /100 | #277 | Tragic 12.6% |
| Central American Indians | 0.0 /100 | #278 | Tragic 12.7% |
| Slovaks | 0.0 /100 | #279 | Tragic 12.7% |
| Dutch | 0.0 /100 | #280 | Tragic 12.7% |
Demographics Similar to Immigrants from Cambodia by Male Disability
In terms of male disability, the demographic groups most similar to Immigrants from Cambodia are Serbian (11.5%, a difference of 0.0%), Jamaican (11.5%, a difference of 0.010%), Ukrainian (11.5%, a difference of 0.010%), Immigrants from Somalia (11.5%, a difference of 0.050%), and Icelander (11.6%, a difference of 0.090%).
| Demographics | Rating | Rank | Male Disability |
| Somalis | 18.2 /100 | #197 | Poor 11.4% |
| Immigrants | Jamaica | 16.3 /100 | #198 | Poor 11.5% |
| Lebanese | 15.4 /100 | #199 | Poor 11.5% |
| Immigrants | Iraq | 13.0 /100 | #200 | Poor 11.5% |
| Immigrants | Panama | 13.0 /100 | #201 | Poor 11.5% |
| Immigrants | Mexico | 12.6 /100 | #202 | Poor 11.5% |
| Jamaicans | 10.9 /100 | #203 | Poor 11.5% |
| Immigrants | Cambodia | 10.8 /100 | #204 | Poor 11.5% |
| Serbians | 10.7 /100 | #205 | Poor 11.5% |
| Ukrainians | 10.6 /100 | #206 | Poor 11.5% |
| Immigrants | Somalia | 10.4 /100 | #207 | Poor 11.5% |
| Icelanders | 10.1 /100 | #208 | Poor 11.6% |
| Spanish American Indians | 10.1 /100 | #209 | Poor 11.6% |
| Ute | 9.4 /100 | #210 | Tragic 11.6% |
| Immigrants | Thailand | 8.4 /100 | #211 | Tragic 11.6% |