Native Hawaiian vs Marshallese Male Disability
COMPARE
Native Hawaiian
Marshallese
Male Disability
Male Disability Comparison
Native Hawaiians
Marshallese
12.5%
MALE DISABILITY
0.0/ 100
METRIC RATING
273rd/ 347
METRIC RANK
12.9%
MALE DISABILITY
0.0/ 100
METRIC RATING
294th/ 347
METRIC RANK
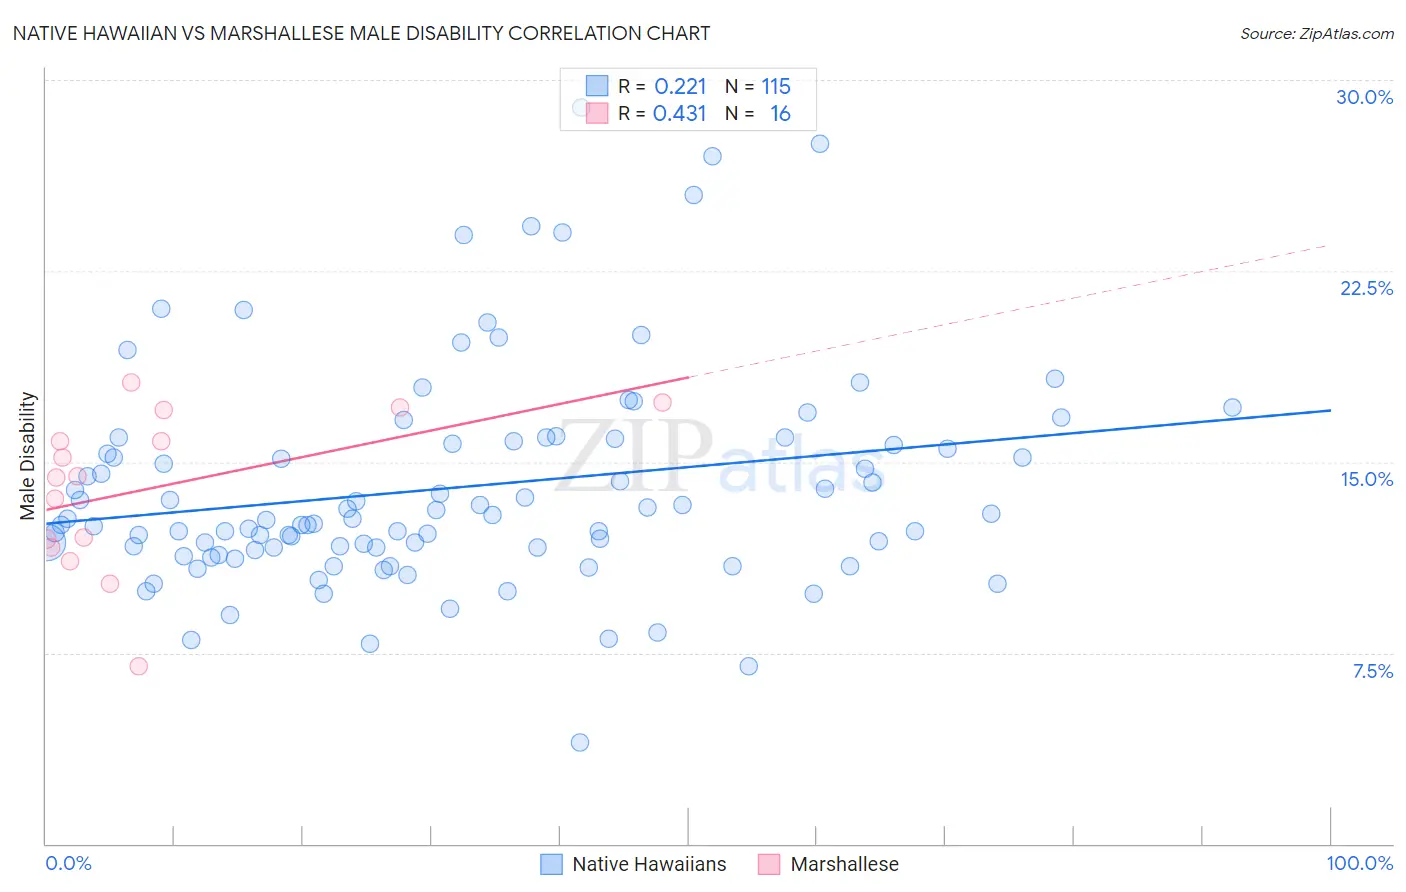
Native Hawaiian vs Marshallese Male Disability Correlation Chart
The statistical analysis conducted on geographies consisting of 332,022,677 people shows a weak positive correlation between the proportion of Native Hawaiians and percentage of males with a disability in the United States with a correlation coefficient (R) of 0.221 and weighted average of 12.5%. Similarly, the statistical analysis conducted on geographies consisting of 14,761,315 people shows a moderate positive correlation between the proportion of Marshallese and percentage of males with a disability in the United States with a correlation coefficient (R) of 0.431 and weighted average of 12.9%, a difference of 3.5%.
Male Disability Correlation Summary
| Measurement | Native Hawaiian | Marshallese |
| Minimum | 4.0% | 7.0% |
| Maximum | 28.9% | 18.1% |
| Range | 25.0% | 11.1% |
| Mean | 14.0% | 13.9% |
| Median | 12.8% | 14.4% |
| Interquartile 25% (IQ1) | 11.6% | 11.8% |
| Interquartile 75% (IQ3) | 15.8% | 16.4% |
| Interquartile Range (IQR) | 4.2% | 4.6% |
| Standard Deviation (Sample) | 4.3% | 3.1% |
| Standard Deviation (Population) | 4.3% | 3.0% |
Similar Demographics by Male Disability
Demographics Similar to Native Hawaiians by Male Disability
In terms of male disability, the demographic groups most similar to Native Hawaiians are Hmong (12.5%, a difference of 0.060%), Hopi (12.5%, a difference of 0.33%), Fijian (12.6%, a difference of 0.68%), African (12.6%, a difference of 0.74%), and Finnish (12.6%, a difference of 1.1%).
| Demographics | Rating | Rank | Male Disability |
| Hawaiians | 0.1 /100 | #266 | Tragic 12.3% |
| Immigrants | Germany | 0.1 /100 | #267 | Tragic 12.3% |
| Portuguese | 0.1 /100 | #268 | Tragic 12.3% |
| Czechoslovakians | 0.1 /100 | #269 | Tragic 12.3% |
| Spaniards | 0.1 /100 | #270 | Tragic 12.3% |
| Scandinavians | 0.1 /100 | #271 | Tragic 12.3% |
| Hmong | 0.0 /100 | #272 | Tragic 12.5% |
| Native Hawaiians | 0.0 /100 | #273 | Tragic 12.5% |
| Hopi | 0.0 /100 | #274 | Tragic 12.5% |
| Fijians | 0.0 /100 | #275 | Tragic 12.6% |
| Africans | 0.0 /100 | #276 | Tragic 12.6% |
| Finns | 0.0 /100 | #277 | Tragic 12.6% |
| Central American Indians | 0.0 /100 | #278 | Tragic 12.7% |
| Slovaks | 0.0 /100 | #279 | Tragic 12.7% |
| Dutch | 0.0 /100 | #280 | Tragic 12.7% |
Demographics Similar to Marshallese by Male Disability
In terms of male disability, the demographic groups most similar to Marshallese are Immigrants from Micronesia (12.9%, a difference of 0.10%), Nonimmigrants (12.9%, a difference of 0.16%), Yaqui (12.9%, a difference of 0.24%), Inupiat (13.0%, a difference of 0.27%), and Pennsylvania German (13.0%, a difference of 0.47%).
| Demographics | Rating | Rank | Male Disability |
| Cape Verdeans | 0.0 /100 | #287 | Tragic 12.8% |
| Yup'ik | 0.0 /100 | #288 | Tragic 12.8% |
| Immigrants | Cabo Verde | 0.0 /100 | #289 | Tragic 12.8% |
| Pima | 0.0 /100 | #290 | Tragic 12.8% |
| Whites/Caucasians | 0.0 /100 | #291 | Tragic 12.8% |
| English | 0.0 /100 | #292 | Tragic 12.8% |
| Yaqui | 0.0 /100 | #293 | Tragic 12.9% |
| Marshallese | 0.0 /100 | #294 | Tragic 12.9% |
| Immigrants | Micronesia | 0.0 /100 | #295 | Tragic 12.9% |
| Immigrants | Nonimmigrants | 0.0 /100 | #296 | Tragic 12.9% |
| Inupiat | 0.0 /100 | #297 | Tragic 13.0% |
| Pennsylvania Germans | 0.0 /100 | #298 | Tragic 13.0% |
| Celtics | 0.0 /100 | #299 | Tragic 13.0% |
| Cheyenne | 0.0 /100 | #300 | Tragic 13.0% |
| French | 0.0 /100 | #301 | Tragic 13.0% |