Macedonian vs Cuban Disability Age 5 to 17
COMPARE
Macedonian
Cuban
Disability Age 5 to 17
Disability Age 5 to 17 Comparison
Macedonians
Cubans
5.2%
DISABILITY AGE 5 TO 17
99.8/ 100
METRIC RATING
67th/ 347
METRIC RANK
5.3%
DISABILITY AGE 5 TO 17
97.8/ 100
METRIC RATING
115th/ 347
METRIC RANK
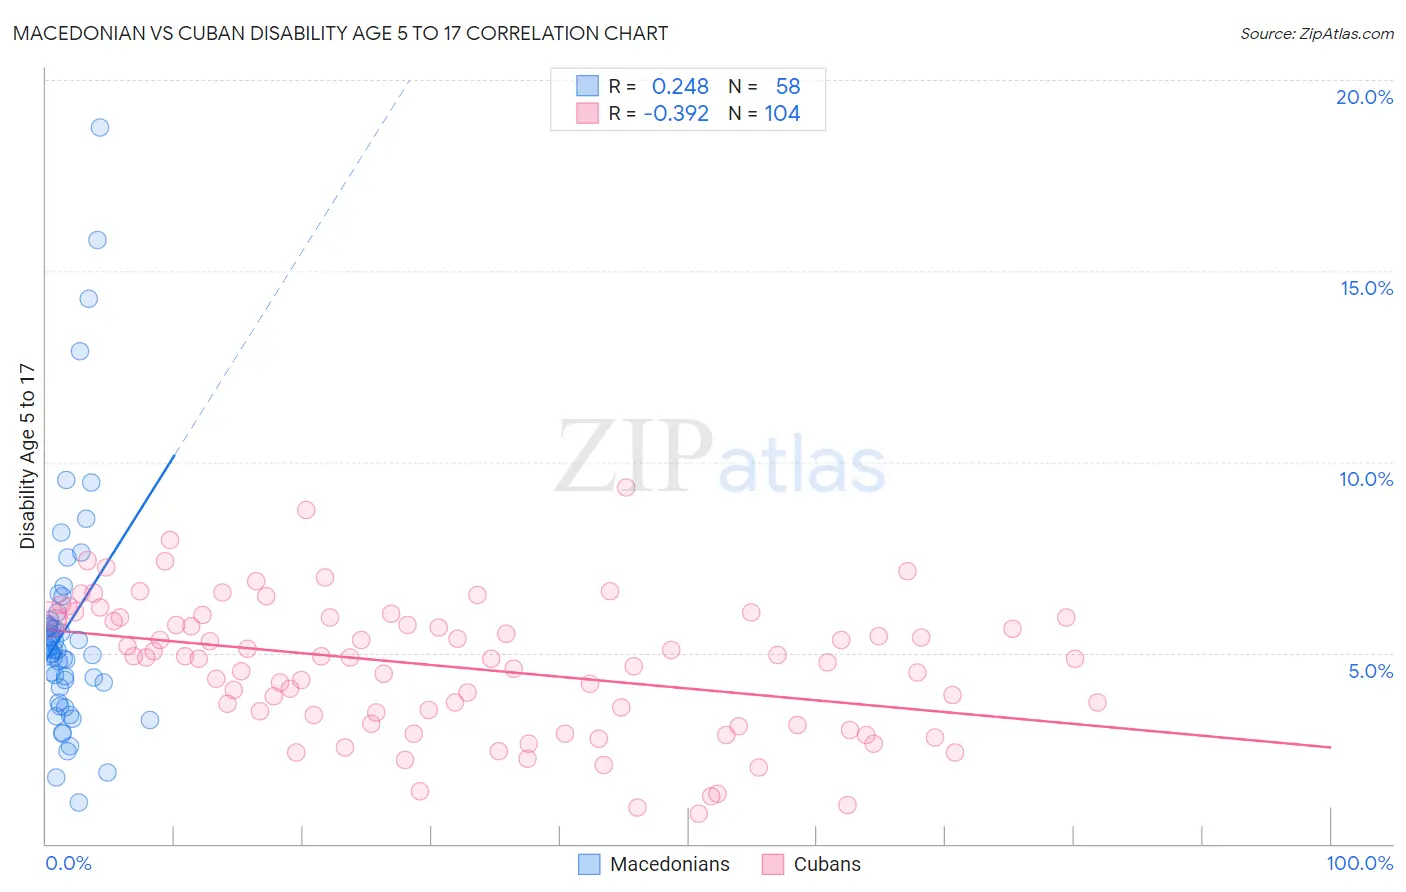
Macedonian vs Cuban Disability Age 5 to 17 Correlation Chart
The statistical analysis conducted on geographies consisting of 132,067,299 people shows a weak positive correlation between the proportion of Macedonians and percentage of population with a disability between the ages 5 and 17 in the United States with a correlation coefficient (R) of 0.248 and weighted average of 5.2%. Similarly, the statistical analysis conducted on geographies consisting of 444,786,844 people shows a mild negative correlation between the proportion of Cubans and percentage of population with a disability between the ages 5 and 17 in the United States with a correlation coefficient (R) of -0.392 and weighted average of 5.3%, a difference of 3.0%.
Disability Age 5 to 17 Correlation Summary
| Measurement | Macedonian | Cuban |
| Minimum | 1.1% | 0.78% |
| Maximum | 18.8% | 9.3% |
| Range | 17.7% | 8.5% |
| Mean | 5.7% | 4.6% |
| Median | 5.1% | 4.9% |
| Interquartile 25% (IQ1) | 4.1% | 3.3% |
| Interquartile 75% (IQ3) | 5.9% | 5.9% |
| Interquartile Range (IQR) | 1.8% | 2.6% |
| Standard Deviation (Sample) | 3.2% | 1.8% |
| Standard Deviation (Population) | 3.2% | 1.8% |
Similar Demographics by Disability Age 5 to 17
Demographics Similar to Macedonians by Disability Age 5 to 17
In terms of disability age 5 to 17, the demographic groups most similar to Macedonians are Palestinian (5.2%, a difference of 0.030%), Immigrants from Greece (5.2%, a difference of 0.070%), Immigrants from South Eastern Asia (5.2%, a difference of 0.080%), Immigrants from Bangladesh (5.2%, a difference of 0.11%), and Immigrants from Syria (5.2%, a difference of 0.14%).
| Demographics | Rating | Rank | Disability Age 5 to 17 |
| Immigrants | Eastern Europe | 99.9 /100 | #60 | Exceptional 5.1% |
| Immigrants | Switzerland | 99.8 /100 | #61 | Exceptional 5.2% |
| Immigrants | Ireland | 99.8 /100 | #62 | Exceptional 5.2% |
| Immigrants | Bangladesh | 99.8 /100 | #63 | Exceptional 5.2% |
| Immigrants | South Eastern Asia | 99.8 /100 | #64 | Exceptional 5.2% |
| Immigrants | Greece | 99.8 /100 | #65 | Exceptional 5.2% |
| Palestinians | 99.8 /100 | #66 | Exceptional 5.2% |
| Macedonians | 99.8 /100 | #67 | Exceptional 5.2% |
| Immigrants | Syria | 99.7 /100 | #68 | Exceptional 5.2% |
| Guyanese | 99.7 /100 | #69 | Exceptional 5.2% |
| Immigrants | Belgium | 99.7 /100 | #70 | Exceptional 5.2% |
| Jordanians | 99.7 /100 | #71 | Exceptional 5.2% |
| Immigrants | Vietnam | 99.7 /100 | #72 | Exceptional 5.2% |
| Immigrants | Czechoslovakia | 99.7 /100 | #73 | Exceptional 5.2% |
| Immigrants | Romania | 99.7 /100 | #74 | Exceptional 5.2% |
Demographics Similar to Cubans by Disability Age 5 to 17
In terms of disability age 5 to 17, the demographic groups most similar to Cubans are Immigrants from Northern Europe (5.3%, a difference of 0.010%), Aleut (5.3%, a difference of 0.040%), Cypriot (5.3%, a difference of 0.060%), Immigrants from Latvia (5.3%, a difference of 0.080%), and Ethiopian (5.3%, a difference of 0.10%).
| Demographics | Rating | Rank | Disability Age 5 to 17 |
| Immigrants | South Africa | 98.1 /100 | #108 | Exceptional 5.3% |
| Immigrants | Northern Africa | 98.1 /100 | #109 | Exceptional 5.3% |
| Immigrants | Eritrea | 98.0 /100 | #110 | Exceptional 5.3% |
| Ethiopians | 97.9 /100 | #111 | Exceptional 5.3% |
| Immigrants | Latvia | 97.9 /100 | #112 | Exceptional 5.3% |
| Aleuts | 97.8 /100 | #113 | Exceptional 5.3% |
| Immigrants | Northern Europe | 97.8 /100 | #114 | Exceptional 5.3% |
| Cubans | 97.8 /100 | #115 | Exceptional 5.3% |
| Cypriots | 97.7 /100 | #116 | Exceptional 5.3% |
| Immigrants | Afghanistan | 97.4 /100 | #117 | Exceptional 5.3% |
| South Americans | 97.1 /100 | #118 | Exceptional 5.4% |
| Immigrants | South America | 97.1 /100 | #119 | Exceptional 5.4% |
| Immigrants | Immigrants | 97.0 /100 | #120 | Exceptional 5.4% |
| Maltese | 96.0 /100 | #121 | Exceptional 5.4% |
| Chileans | 95.8 /100 | #122 | Exceptional 5.4% |