Lithuanian vs Scottish Unemployment Among Seniors over 75 years
COMPARE
Lithuanian
Scottish
Unemployment Among Seniors over 75 years
Unemployment Among Seniors over 75 years Comparison
Lithuanians
Scottish
9.9%
UNEMPLOYMENT AMONG SENIORS OVER 75 YEARS
0.0/ 100
METRIC RATING
298th/ 347
METRIC RANK
10.1%
UNEMPLOYMENT AMONG SENIORS OVER 75 YEARS
0.0/ 100
METRIC RATING
311th/ 347
METRIC RANK
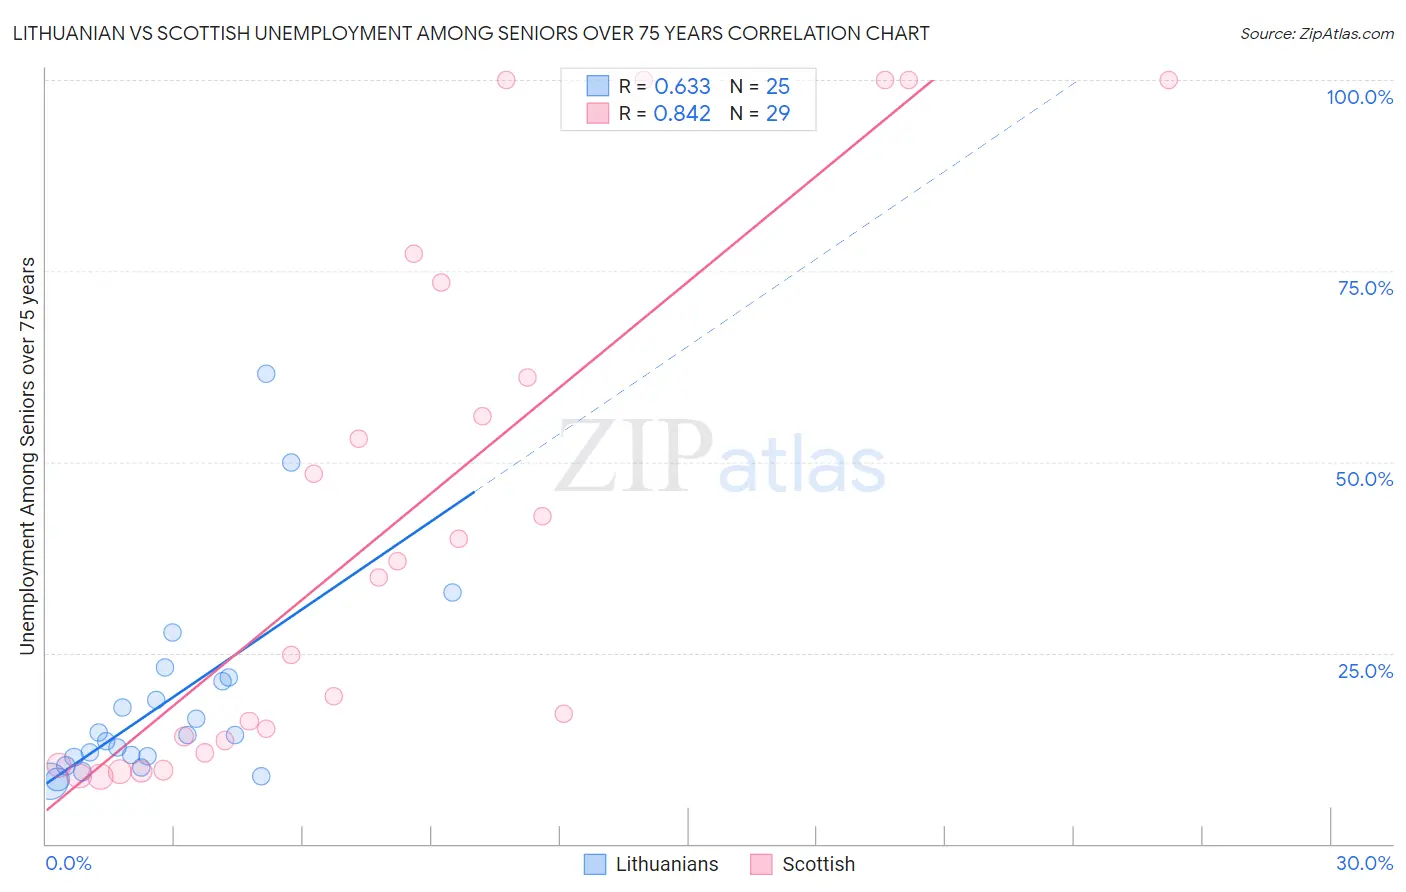
Lithuanian vs Scottish Unemployment Among Seniors over 75 years Correlation Chart
The statistical analysis conducted on geographies consisting of 208,094,168 people shows a significant positive correlation between the proportion of Lithuanians and unemployment rate among seniors over the age of 75 in the United States with a correlation coefficient (R) of 0.633 and weighted average of 9.9%. Similarly, the statistical analysis conducted on geographies consisting of 233,245,768 people shows a very strong positive correlation between the proportion of Scottish and unemployment rate among seniors over the age of 75 in the United States with a correlation coefficient (R) of 0.842 and weighted average of 10.1%, a difference of 2.2%.
Unemployment Among Seniors over 75 years Correlation Summary
| Measurement | Lithuanian | Scottish |
| Minimum | 8.1% | 8.8% |
| Maximum | 61.5% | 100.0% |
| Range | 53.4% | 91.2% |
| Mean | 18.5% | 41.8% |
| Median | 14.2% | 34.9% |
| Interquartile 25% (IQ1) | 10.8% | 12.7% |
| Interquartile 75% (IQ3) | 21.5% | 67.3% |
| Interquartile Range (IQR) | 10.8% | 54.6% |
| Standard Deviation (Sample) | 12.9% | 33.6% |
| Standard Deviation (Population) | 12.7% | 33.0% |
Demographics Similar to Lithuanians and Scottish by Unemployment Among Seniors over 75 years
In terms of unemployment among seniors over 75 years, the demographic groups most similar to Lithuanians are Belgian (9.9%, a difference of 0.28%), Iraqi (9.9%, a difference of 0.30%), Cherokee (9.8%, a difference of 0.38%), Immigrants from St. Vincent and the Grenadines (9.8%, a difference of 0.46%), and Nonimmigrants (9.8%, a difference of 0.51%). Similarly, the demographic groups most similar to Scottish are Chippewa (10.1%, a difference of 0.010%), Hungarian (10.1%, a difference of 0.11%), Nepalese (10.1%, a difference of 0.13%), English (10.1%, a difference of 0.30%), and White/Caucasian (10.1%, a difference of 0.37%).
| Demographics | Rating | Rank | Unemployment Among Seniors over 75 years |
| Immigrants | Dominica | 0.0 /100 | #294 | Tragic 9.8% |
| Immigrants | Nonimmigrants | 0.0 /100 | #295 | Tragic 9.8% |
| Immigrants | St. Vincent and the Grenadines | 0.0 /100 | #296 | Tragic 9.8% |
| Cherokee | 0.0 /100 | #297 | Tragic 9.8% |
| Lithuanians | 0.0 /100 | #298 | Tragic 9.9% |
| Belgians | 0.0 /100 | #299 | Tragic 9.9% |
| Iraqis | 0.0 /100 | #300 | Tragic 9.9% |
| Welsh | 0.0 /100 | #301 | Tragic 10.0% |
| Finns | 0.0 /100 | #302 | Tragic 10.0% |
| Puget Sound Salish | 0.0 /100 | #303 | Tragic 10.0% |
| Scotch-Irish | 0.0 /100 | #304 | Tragic 10.0% |
| Swedes | 0.0 /100 | #305 | Tragic 10.0% |
| Italians | 0.0 /100 | #306 | Tragic 10.0% |
| Immigrants | Fiji | 0.0 /100 | #307 | Tragic 10.0% |
| Whites/Caucasians | 0.0 /100 | #308 | Tragic 10.1% |
| English | 0.0 /100 | #309 | Tragic 10.1% |
| Hungarians | 0.0 /100 | #310 | Tragic 10.1% |
| Scottish | 0.0 /100 | #311 | Tragic 10.1% |
| Chippewa | 0.0 /100 | #312 | Tragic 10.1% |
| Nepalese | 0.0 /100 | #313 | Tragic 10.1% |
| Dutch West Indians | 0.0 /100 | #314 | Tragic 10.2% |