Lithuanian vs Scotch-Irish Disability Age Under 5
COMPARE
Lithuanian
Scotch-Irish
Disability Age Under 5
Disability Age Under 5 Comparison
Lithuanians
Scotch-Irish
1.6%
DISABILITY AGE UNDER 5
0.0/ 100
METRIC RATING
293rd/ 347
METRIC RANK
1.7%
DISABILITY AGE UNDER 5
0.0/ 100
METRIC RATING
320th/ 347
METRIC RANK
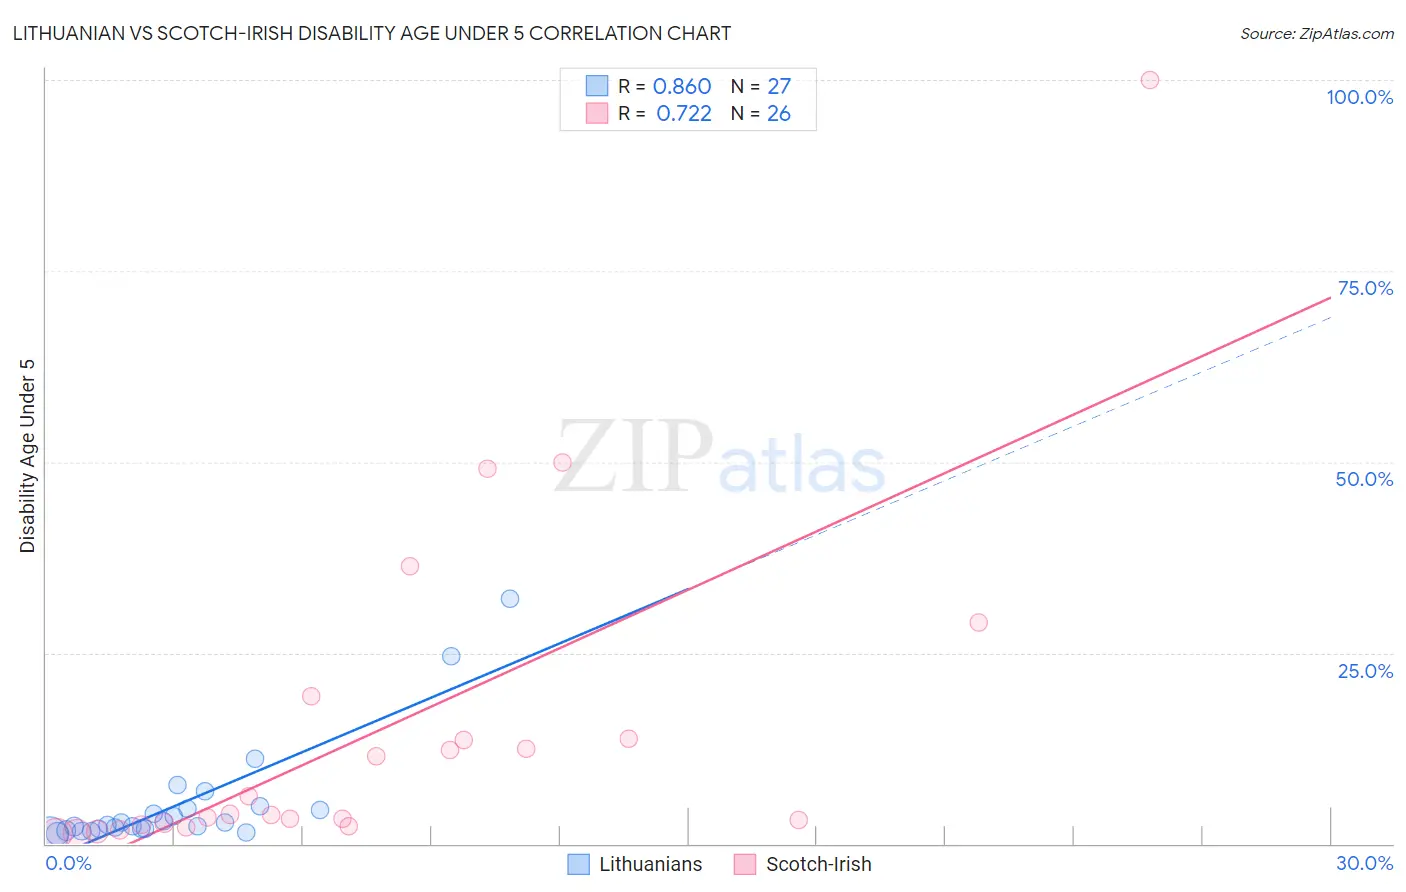
Lithuanian vs Scotch-Irish Disability Age Under 5 Correlation Chart
The statistical analysis conducted on geographies consisting of 215,672,117 people shows a very strong positive correlation between the proportion of Lithuanians and percentage of population with a disability under the age of 5 in the United States with a correlation coefficient (R) of 0.860 and weighted average of 1.6%. Similarly, the statistical analysis conducted on geographies consisting of 253,637,747 people shows a strong positive correlation between the proportion of Scotch-Irish and percentage of population with a disability under the age of 5 in the United States with a correlation coefficient (R) of 0.722 and weighted average of 1.7%, a difference of 9.5%.
Disability Age Under 5 Correlation Summary
| Measurement | Lithuanian | Scotch-Irish |
| Minimum | 1.2% | 1.3% |
| Maximum | 32.1% | 100.0% |
| Range | 31.0% | 98.7% |
| Mean | 5.1% | 15.0% |
| Median | 2.4% | 3.8% |
| Interquartile 25% (IQ1) | 1.9% | 2.5% |
| Interquartile 75% (IQ3) | 4.6% | 13.7% |
| Interquartile Range (IQR) | 2.7% | 11.1% |
| Standard Deviation (Sample) | 7.1% | 22.4% |
| Standard Deviation (Population) | 7.0% | 22.0% |
Similar Demographics by Disability Age Under 5
Demographics Similar to Lithuanians by Disability Age Under 5
In terms of disability age under 5, the demographic groups most similar to Lithuanians are Italian (1.6%, a difference of 0.46%), Northern European (1.6%, a difference of 0.61%), Czech (1.5%, a difference of 0.70%), Hungarian (1.5%, a difference of 0.83%), and Estonian (1.5%, a difference of 0.97%).
| Demographics | Rating | Rank | Disability Age Under 5 |
| Tlingit-Haida | 0.0 /100 | #286 | Tragic 1.5% |
| Scandinavians | 0.0 /100 | #287 | Tragic 1.5% |
| Estonians | 0.0 /100 | #288 | Tragic 1.5% |
| Hungarians | 0.0 /100 | #289 | Tragic 1.5% |
| Czechs | 0.0 /100 | #290 | Tragic 1.5% |
| Northern Europeans | 0.0 /100 | #291 | Tragic 1.6% |
| Italians | 0.0 /100 | #292 | Tragic 1.6% |
| Lithuanians | 0.0 /100 | #293 | Tragic 1.6% |
| Swedes | 0.0 /100 | #294 | Tragic 1.6% |
| Finns | 0.0 /100 | #295 | Tragic 1.6% |
| Poles | 0.0 /100 | #296 | Tragic 1.6% |
| Immigrants | Nonimmigrants | 0.0 /100 | #297 | Tragic 1.6% |
| Cajuns | 0.0 /100 | #298 | Tragic 1.6% |
| Portuguese | 0.0 /100 | #299 | Tragic 1.6% |
| Shoshone | 0.0 /100 | #300 | Tragic 1.6% |
Demographics Similar to Scotch-Irish by Disability Age Under 5
In terms of disability age under 5, the demographic groups most similar to Scotch-Irish are Ottawa (1.7%, a difference of 0.060%), Slovak (1.7%, a difference of 0.53%), German (1.7%, a difference of 0.63%), Irish (1.7%, a difference of 0.84%), and French (1.7%, a difference of 1.1%).
| Demographics | Rating | Rank | Disability Age Under 5 |
| Celtics | 0.0 /100 | #313 | Tragic 1.7% |
| Norwegians | 0.0 /100 | #314 | Tragic 1.7% |
| Dutch | 0.0 /100 | #315 | Tragic 1.7% |
| Immigrants | Cabo Verde | 0.0 /100 | #316 | Tragic 1.7% |
| French | 0.0 /100 | #317 | Tragic 1.7% |
| Irish | 0.0 /100 | #318 | Tragic 1.7% |
| Slovaks | 0.0 /100 | #319 | Tragic 1.7% |
| Scotch-Irish | 0.0 /100 | #320 | Tragic 1.7% |
| Ottawa | 0.0 /100 | #321 | Tragic 1.7% |
| Germans | 0.0 /100 | #322 | Tragic 1.7% |
| Chickasaw | 0.0 /100 | #323 | Tragic 1.7% |
| Cherokee | 0.0 /100 | #324 | Tragic 1.8% |
| Immigrants | Portugal | 0.0 /100 | #325 | Tragic 1.8% |
| Sioux | 0.0 /100 | #326 | Tragic 1.8% |
| Osage | 0.0 /100 | #327 | Tragic 1.8% |