Lithuanian vs Indonesian Disability Age Under 5
COMPARE
Lithuanian
Indonesian
Disability Age Under 5
Disability Age Under 5 Comparison
Lithuanians
Indonesians
1.6%
DISABILITY AGE UNDER 5
0.0/ 100
METRIC RATING
293rd/ 347
METRIC RANK
1.2%
DISABILITY AGE UNDER 5
95.9/ 100
METRIC RATING
104th/ 347
METRIC RANK
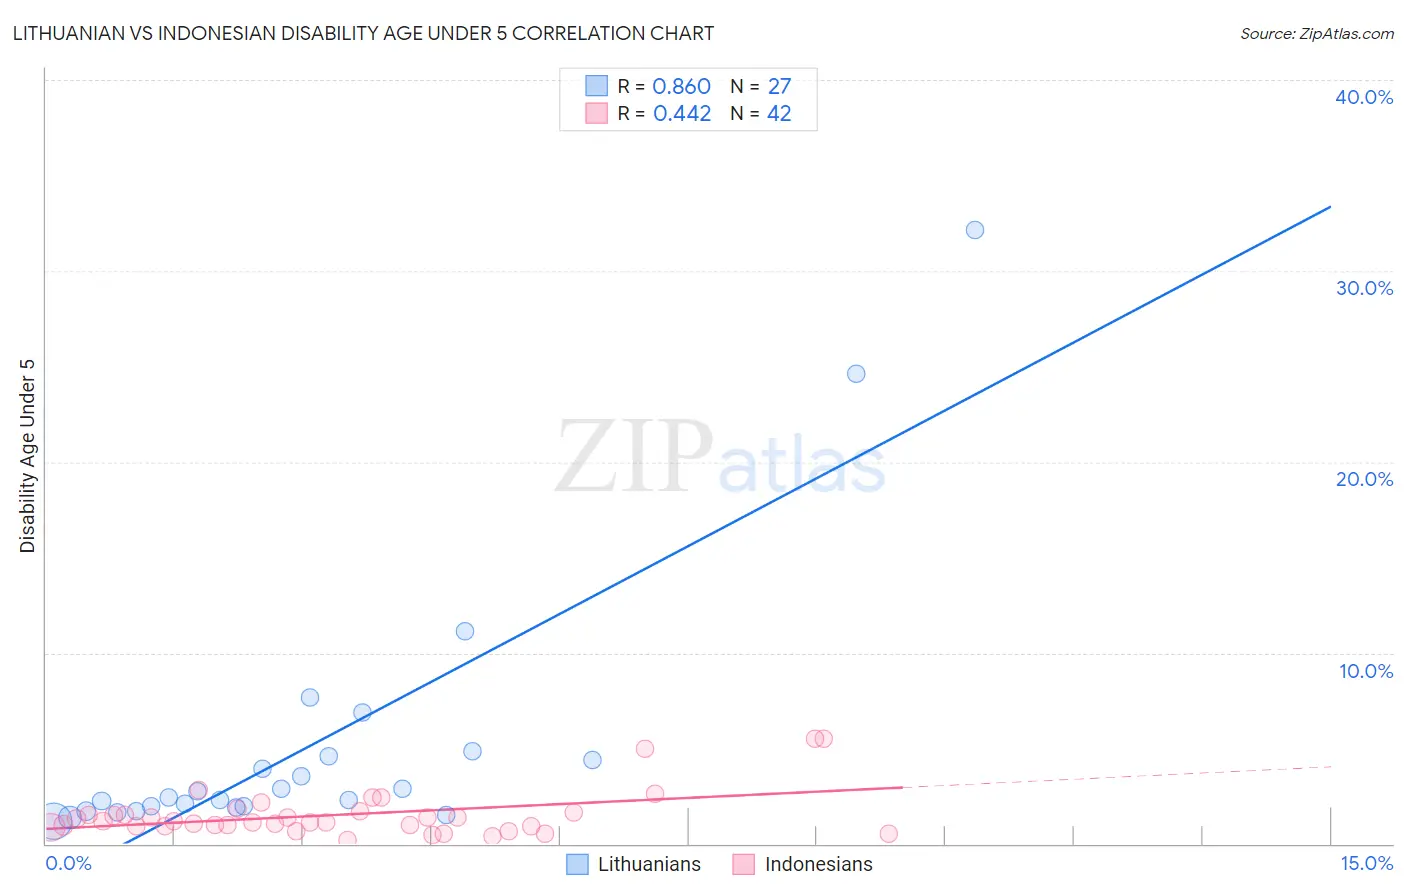
Lithuanian vs Indonesian Disability Age Under 5 Correlation Chart
The statistical analysis conducted on geographies consisting of 215,672,117 people shows a very strong positive correlation between the proportion of Lithuanians and percentage of population with a disability under the age of 5 in the United States with a correlation coefficient (R) of 0.860 and weighted average of 1.6%. Similarly, the statistical analysis conducted on geographies consisting of 116,670,957 people shows a moderate positive correlation between the proportion of Indonesians and percentage of population with a disability under the age of 5 in the United States with a correlation coefficient (R) of 0.442 and weighted average of 1.2%, a difference of 35.6%.
Disability Age Under 5 Correlation Summary
| Measurement | Lithuanian | Indonesian |
| Minimum | 1.2% | 0.21% |
| Maximum | 32.1% | 5.5% |
| Range | 31.0% | 5.3% |
| Mean | 5.1% | 1.5% |
| Median | 2.4% | 1.1% |
| Interquartile 25% (IQ1) | 1.9% | 0.90% |
| Interquartile 75% (IQ3) | 4.6% | 1.7% |
| Interquartile Range (IQR) | 2.7% | 0.76% |
| Standard Deviation (Sample) | 7.1% | 1.2% |
| Standard Deviation (Population) | 7.0% | 1.2% |
Similar Demographics by Disability Age Under 5
Demographics Similar to Lithuanians by Disability Age Under 5
In terms of disability age under 5, the demographic groups most similar to Lithuanians are Italian (1.6%, a difference of 0.46%), Northern European (1.6%, a difference of 0.61%), Czech (1.5%, a difference of 0.70%), Hungarian (1.5%, a difference of 0.83%), and Estonian (1.5%, a difference of 0.97%).
| Demographics | Rating | Rank | Disability Age Under 5 |
| Tlingit-Haida | 0.0 /100 | #286 | Tragic 1.5% |
| Scandinavians | 0.0 /100 | #287 | Tragic 1.5% |
| Estonians | 0.0 /100 | #288 | Tragic 1.5% |
| Hungarians | 0.0 /100 | #289 | Tragic 1.5% |
| Czechs | 0.0 /100 | #290 | Tragic 1.5% |
| Northern Europeans | 0.0 /100 | #291 | Tragic 1.6% |
| Italians | 0.0 /100 | #292 | Tragic 1.6% |
| Lithuanians | 0.0 /100 | #293 | Tragic 1.6% |
| Swedes | 0.0 /100 | #294 | Tragic 1.6% |
| Finns | 0.0 /100 | #295 | Tragic 1.6% |
| Poles | 0.0 /100 | #296 | Tragic 1.6% |
| Immigrants | Nonimmigrants | 0.0 /100 | #297 | Tragic 1.6% |
| Cajuns | 0.0 /100 | #298 | Tragic 1.6% |
| Portuguese | 0.0 /100 | #299 | Tragic 1.6% |
| Shoshone | 0.0 /100 | #300 | Tragic 1.6% |
Demographics Similar to Indonesians by Disability Age Under 5
In terms of disability age under 5, the demographic groups most similar to Indonesians are Immigrants from Morocco (1.2%, a difference of 0.070%), Immigrants from Nicaragua (1.2%, a difference of 0.070%), Immigrants from Uganda (1.1%, a difference of 0.12%), Immigrants from South Africa (1.2%, a difference of 0.19%), and Nicaraguan (1.1%, a difference of 0.24%).
| Demographics | Rating | Rank | Disability Age Under 5 |
| Immigrants | Iraq | 96.5 /100 | #97 | Exceptional 1.1% |
| Immigrants | South Eastern Asia | 96.5 /100 | #98 | Exceptional 1.1% |
| Dominicans | 96.3 /100 | #99 | Exceptional 1.1% |
| Nicaraguans | 96.3 /100 | #100 | Exceptional 1.1% |
| Immigrants | Uganda | 96.1 /100 | #101 | Exceptional 1.1% |
| Immigrants | Morocco | 96.0 /100 | #102 | Exceptional 1.2% |
| Immigrants | Nicaragua | 96.0 /100 | #103 | Exceptional 1.2% |
| Indonesians | 95.9 /100 | #104 | Exceptional 1.2% |
| Immigrants | South Africa | 95.6 /100 | #105 | Exceptional 1.2% |
| Cambodians | 95.4 /100 | #106 | Exceptional 1.2% |
| Immigrants | West Indies | 95.3 /100 | #107 | Exceptional 1.2% |
| Iraqis | 95.1 /100 | #108 | Exceptional 1.2% |
| Immigrants | Panama | 95.0 /100 | #109 | Exceptional 1.2% |
| Immigrants | Lebanon | 95.0 /100 | #110 | Exceptional 1.2% |
| Senegalese | 94.6 /100 | #111 | Exceptional 1.2% |