Lithuanian vs Scotch-Irish Family Households
COMPARE
Lithuanian
Scotch-Irish
Family Households
Family Households Comparison
Lithuanians
Scotch-Irish
64.0%
FAMILY HOUSEHOLDS
23.8/ 100
METRIC RATING
192nd/ 347
METRIC RANK
64.4%
FAMILY HOUSEHOLDS
59.2/ 100
METRIC RATING
166th/ 347
METRIC RANK
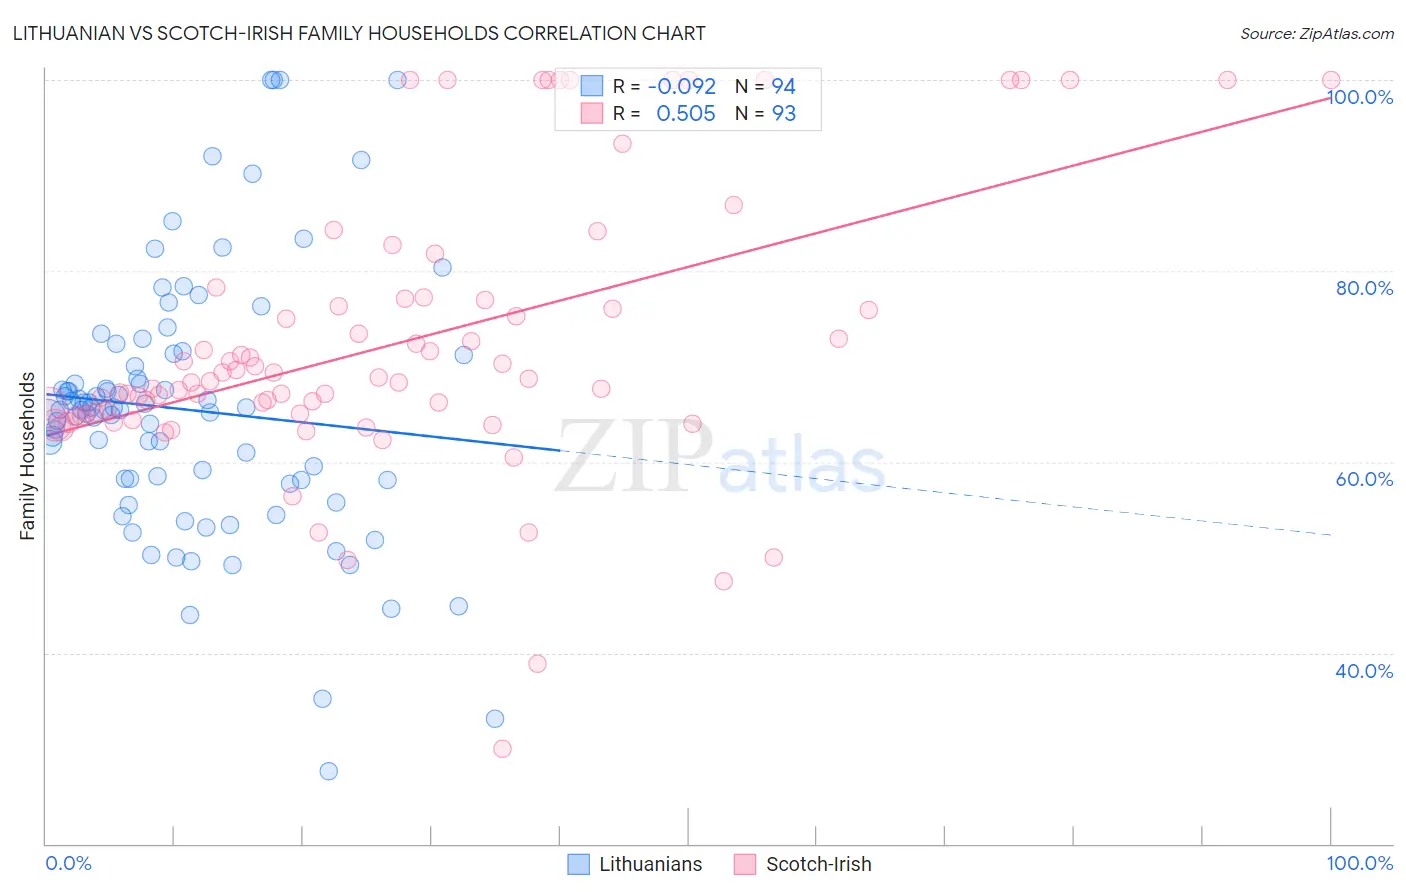
Lithuanian vs Scotch-Irish Family Households Correlation Chart
The statistical analysis conducted on geographies consisting of 421,743,433 people shows a slight negative correlation between the proportion of Lithuanians and percentage of family households in the United States with a correlation coefficient (R) of -0.092 and weighted average of 64.0%. Similarly, the statistical analysis conducted on geographies consisting of 548,372,963 people shows a substantial positive correlation between the proportion of Scotch-Irish and percentage of family households in the United States with a correlation coefficient (R) of 0.505 and weighted average of 64.4%, a difference of 0.52%.
Family Households Correlation Summary
| Measurement | Lithuanian | Scotch-Irish |
| Minimum | 27.6% | 29.9% |
| Maximum | 100.0% | 100.0% |
| Range | 72.4% | 70.1% |
| Mean | 65.5% | 72.5% |
| Median | 65.5% | 68.4% |
| Interquartile 25% (IQ1) | 58.1% | 64.9% |
| Interquartile 75% (IQ3) | 71.3% | 77.0% |
| Interquartile Range (IQR) | 13.1% | 12.1% |
| Standard Deviation (Sample) | 13.6% | 14.6% |
| Standard Deviation (Population) | 13.6% | 14.5% |
Similar Demographics by Family Households
Demographics Similar to Lithuanians by Family Households
In terms of family households, the demographic groups most similar to Lithuanians are French (64.0%, a difference of 0.0%), Arab (64.1%, a difference of 0.010%), Zimbabwean (64.1%, a difference of 0.020%), Immigrants from Western Asia (64.1%, a difference of 0.030%), and Paiute (64.0%, a difference of 0.030%).
| Demographics | Rating | Rank | Family Households |
| Immigrants | Iran | 30.4 /100 | #185 | Fair 64.1% |
| Spanish Americans | 30.1 /100 | #186 | Fair 64.1% |
| Northern Europeans | 28.2 /100 | #187 | Fair 64.1% |
| Paraguayans | 26.7 /100 | #188 | Fair 64.1% |
| Immigrants | Western Asia | 25.3 /100 | #189 | Fair 64.1% |
| Zimbabweans | 24.7 /100 | #190 | Fair 64.1% |
| Arabs | 24.5 /100 | #191 | Fair 64.1% |
| Lithuanians | 23.8 /100 | #192 | Fair 64.0% |
| French | 23.7 /100 | #193 | Fair 64.0% |
| Paiute | 22.2 /100 | #194 | Fair 64.0% |
| Immigrants | North America | 20.0 /100 | #195 | Poor 64.0% |
| Immigrants | Canada | 19.2 /100 | #196 | Poor 64.0% |
| Seminole | 18.9 /100 | #197 | Poor 64.0% |
| Poles | 18.9 /100 | #198 | Poor 64.0% |
| Slavs | 18.6 /100 | #199 | Poor 64.0% |
Demographics Similar to Scotch-Irish by Family Households
In terms of family households, the demographic groups most similar to Scotch-Irish are Immigrants from Nigeria (64.4%, a difference of 0.010%), Immigrants from Southern Europe (64.4%, a difference of 0.010%), Irish (64.4%, a difference of 0.020%), Honduran (64.4%, a difference of 0.020%), and British (64.4%, a difference of 0.030%).
| Demographics | Rating | Rank | Family Households |
| Germans | 65.8 /100 | #159 | Good 64.4% |
| Immigrants | Moldova | 65.2 /100 | #160 | Good 64.4% |
| Immigrants | England | 62.6 /100 | #161 | Good 64.4% |
| British | 61.6 /100 | #162 | Good 64.4% |
| Chickasaw | 61.5 /100 | #163 | Good 64.4% |
| Immigrants | Nigeria | 60.1 /100 | #164 | Good 64.4% |
| Immigrants | Southern Europe | 60.0 /100 | #165 | Good 64.4% |
| Scotch-Irish | 59.2 /100 | #166 | Average 64.4% |
| Irish | 57.9 /100 | #167 | Average 64.4% |
| Hondurans | 57.5 /100 | #168 | Average 64.4% |
| Iraqis | 56.0 /100 | #169 | Average 64.4% |
| Armenians | 55.9 /100 | #170 | Average 64.4% |
| Ute | 54.6 /100 | #171 | Average 64.3% |
| Dutch West Indians | 53.9 /100 | #172 | Average 64.3% |
| Immigrants | Sierra Leone | 52.5 /100 | #173 | Average 64.3% |