Lithuanian vs Immigrants from Cameroon Disability Age Under 5
COMPARE
Lithuanian
Immigrants from Cameroon
Disability Age Under 5
Disability Age Under 5 Comparison
Lithuanians
Immigrants from Cameroon
1.6%
DISABILITY AGE UNDER 5
0.0/ 100
METRIC RATING
293rd/ 347
METRIC RANK
1.4%
DISABILITY AGE UNDER 5
1.7/ 100
METRIC RATING
243rd/ 347
METRIC RANK
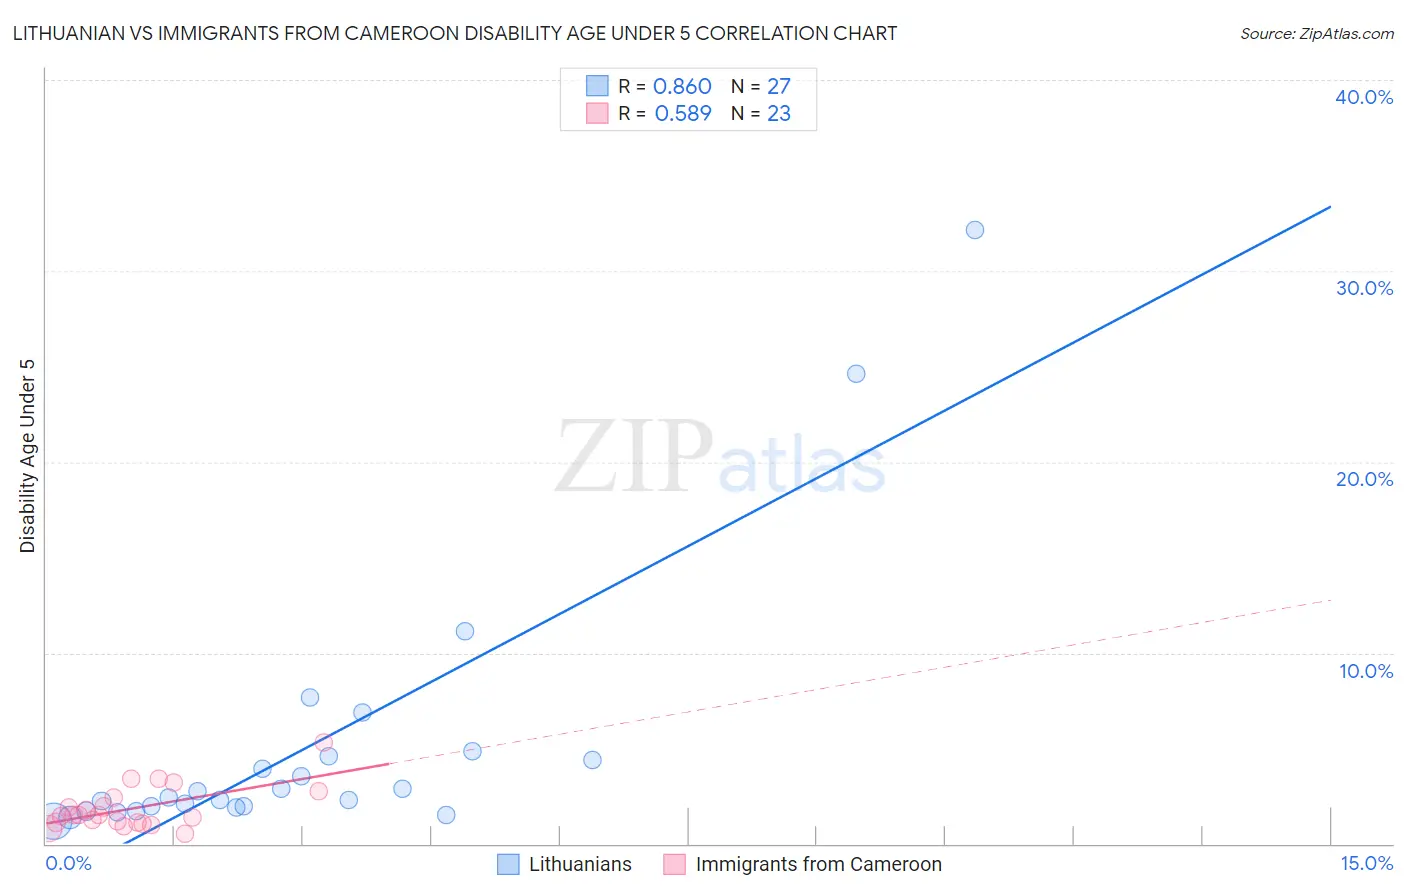
Lithuanian vs Immigrants from Cameroon Disability Age Under 5 Correlation Chart
The statistical analysis conducted on geographies consisting of 215,672,117 people shows a very strong positive correlation between the proportion of Lithuanians and percentage of population with a disability under the age of 5 in the United States with a correlation coefficient (R) of 0.860 and weighted average of 1.6%. Similarly, the statistical analysis conducted on geographies consisting of 95,639,339 people shows a substantial positive correlation between the proportion of Immigrants from Cameroon and percentage of population with a disability under the age of 5 in the United States with a correlation coefficient (R) of 0.589 and weighted average of 1.4%, a difference of 15.4%.
Disability Age Under 5 Correlation Summary
| Measurement | Lithuanian | Immigrants from Cameroon |
| Minimum | 1.2% | 0.51% |
| Maximum | 32.1% | 5.3% |
| Range | 31.0% | 4.8% |
| Mean | 5.1% | 1.8% |
| Median | 2.4% | 1.5% |
| Interquartile 25% (IQ1) | 1.9% | 1.1% |
| Interquartile 75% (IQ3) | 4.6% | 2.4% |
| Interquartile Range (IQR) | 2.7% | 1.3% |
| Standard Deviation (Sample) | 7.1% | 1.1% |
| Standard Deviation (Population) | 7.0% | 1.1% |
Similar Demographics by Disability Age Under 5
Demographics Similar to Lithuanians by Disability Age Under 5
In terms of disability age under 5, the demographic groups most similar to Lithuanians are Italian (1.6%, a difference of 0.46%), Northern European (1.6%, a difference of 0.61%), Czech (1.5%, a difference of 0.70%), Hungarian (1.5%, a difference of 0.83%), and Estonian (1.5%, a difference of 0.97%).
| Demographics | Rating | Rank | Disability Age Under 5 |
| Tlingit-Haida | 0.0 /100 | #286 | Tragic 1.5% |
| Scandinavians | 0.0 /100 | #287 | Tragic 1.5% |
| Estonians | 0.0 /100 | #288 | Tragic 1.5% |
| Hungarians | 0.0 /100 | #289 | Tragic 1.5% |
| Czechs | 0.0 /100 | #290 | Tragic 1.5% |
| Northern Europeans | 0.0 /100 | #291 | Tragic 1.6% |
| Italians | 0.0 /100 | #292 | Tragic 1.6% |
| Lithuanians | 0.0 /100 | #293 | Tragic 1.6% |
| Swedes | 0.0 /100 | #294 | Tragic 1.6% |
| Finns | 0.0 /100 | #295 | Tragic 1.6% |
| Poles | 0.0 /100 | #296 | Tragic 1.6% |
| Immigrants | Nonimmigrants | 0.0 /100 | #297 | Tragic 1.6% |
| Cajuns | 0.0 /100 | #298 | Tragic 1.6% |
| Portuguese | 0.0 /100 | #299 | Tragic 1.6% |
| Shoshone | 0.0 /100 | #300 | Tragic 1.6% |
Demographics Similar to Immigrants from Cameroon by Disability Age Under 5
In terms of disability age under 5, the demographic groups most similar to Immigrants from Cameroon are Lumbee (1.3%, a difference of 0.38%), Spaniard (1.4%, a difference of 0.43%), Maltese (1.3%, a difference of 0.46%), Native Hawaiian (1.3%, a difference of 0.53%), and Immigrants from Austria (1.3%, a difference of 0.56%).
| Demographics | Rating | Rank | Disability Age Under 5 |
| South American Indians | 3.3 /100 | #236 | Tragic 1.3% |
| Basques | 3.0 /100 | #237 | Tragic 1.3% |
| Spanish American Indians | 2.4 /100 | #238 | Tragic 1.3% |
| Immigrants | Austria | 2.3 /100 | #239 | Tragic 1.3% |
| Native Hawaiians | 2.2 /100 | #240 | Tragic 1.3% |
| Maltese | 2.2 /100 | #241 | Tragic 1.3% |
| Lumbee | 2.1 /100 | #242 | Tragic 1.3% |
| Immigrants | Cameroon | 1.7 /100 | #243 | Tragic 1.4% |
| Spaniards | 1.4 /100 | #244 | Tragic 1.4% |
| Potawatomi | 1.1 /100 | #245 | Tragic 1.4% |
| Russians | 1.0 /100 | #246 | Tragic 1.4% |
| Immigrants | England | 1.0 /100 | #247 | Tragic 1.4% |
| Eastern Europeans | 1.0 /100 | #248 | Tragic 1.4% |
| Bermudans | 1.0 /100 | #249 | Tragic 1.4% |
| Africans | 1.0 /100 | #250 | Tragic 1.4% |