Lithuanian vs Afghan Disability Age Under 5
COMPARE
Lithuanian
Afghan
Disability Age Under 5
Disability Age Under 5 Comparison
Lithuanians
Afghans
1.6%
DISABILITY AGE UNDER 5
0.0/ 100
METRIC RATING
293rd/ 347
METRIC RANK
0.94%
DISABILITY AGE UNDER 5
100.0/ 100
METRIC RATING
11th/ 347
METRIC RANK
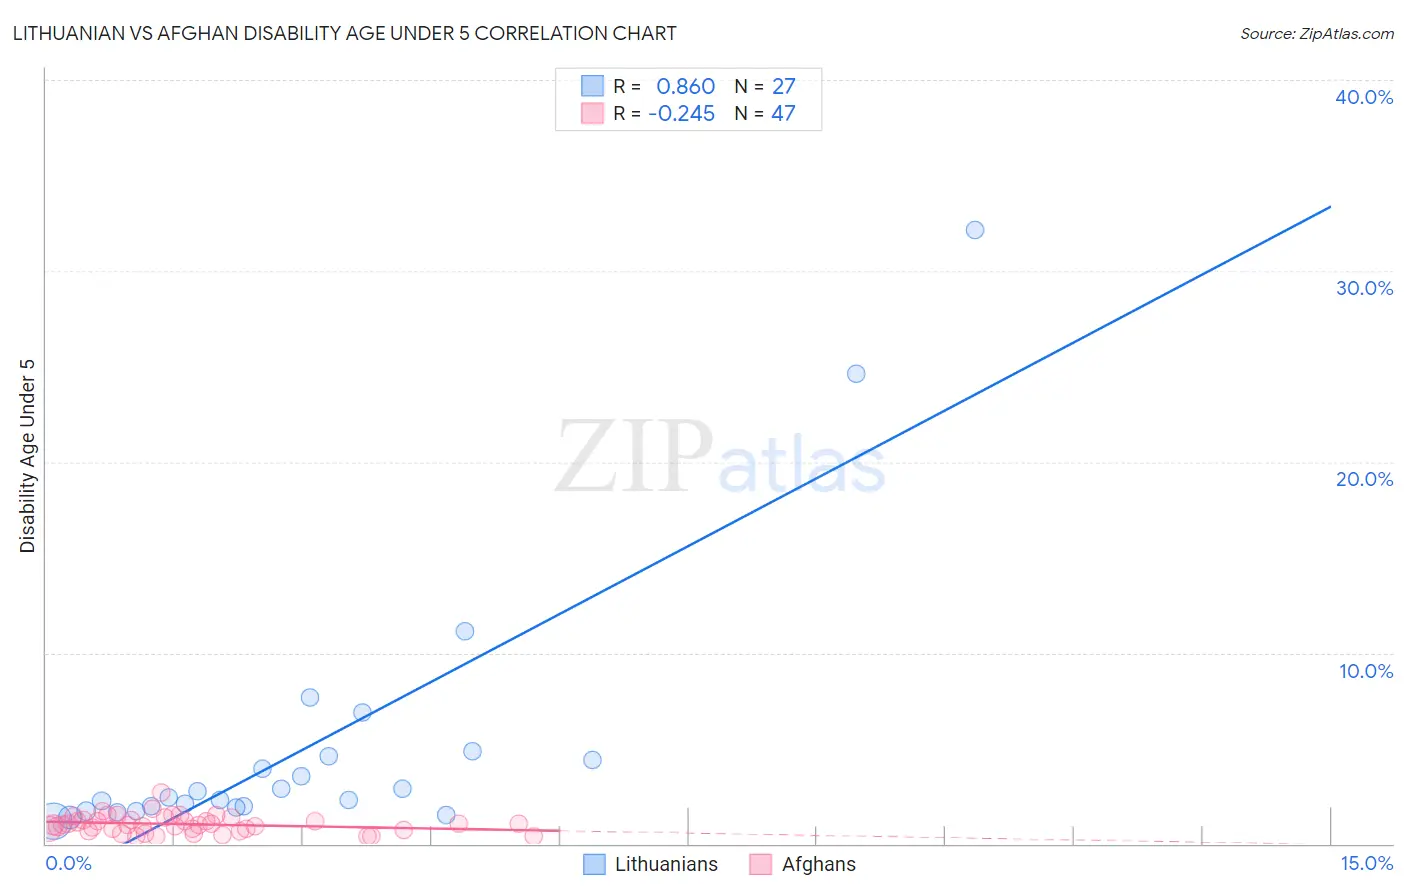
Lithuanian vs Afghan Disability Age Under 5 Correlation Chart
The statistical analysis conducted on geographies consisting of 215,672,117 people shows a very strong positive correlation between the proportion of Lithuanians and percentage of population with a disability under the age of 5 in the United States with a correlation coefficient (R) of 0.860 and weighted average of 1.6%. Similarly, the statistical analysis conducted on geographies consisting of 107,918,931 people shows a weak negative correlation between the proportion of Afghans and percentage of population with a disability under the age of 5 in the United States with a correlation coefficient (R) of -0.245 and weighted average of 0.94%, a difference of 65.4%.
Disability Age Under 5 Correlation Summary
| Measurement | Lithuanian | Afghan |
| Minimum | 1.2% | 0.37% |
| Maximum | 32.1% | 2.7% |
| Range | 31.0% | 2.3% |
| Mean | 5.1% | 1.0% |
| Median | 2.4% | 0.99% |
| Interquartile 25% (IQ1) | 1.9% | 0.74% |
| Interquartile 75% (IQ3) | 4.6% | 1.3% |
| Interquartile Range (IQR) | 2.7% | 0.52% |
| Standard Deviation (Sample) | 7.1% | 0.45% |
| Standard Deviation (Population) | 7.0% | 0.44% |
Similar Demographics by Disability Age Under 5
Demographics Similar to Lithuanians by Disability Age Under 5
In terms of disability age under 5, the demographic groups most similar to Lithuanians are Italian (1.6%, a difference of 0.46%), Northern European (1.6%, a difference of 0.61%), Czech (1.5%, a difference of 0.70%), Hungarian (1.5%, a difference of 0.83%), and Estonian (1.5%, a difference of 0.97%).
| Demographics | Rating | Rank | Disability Age Under 5 |
| Tlingit-Haida | 0.0 /100 | #286 | Tragic 1.5% |
| Scandinavians | 0.0 /100 | #287 | Tragic 1.5% |
| Estonians | 0.0 /100 | #288 | Tragic 1.5% |
| Hungarians | 0.0 /100 | #289 | Tragic 1.5% |
| Czechs | 0.0 /100 | #290 | Tragic 1.5% |
| Northern Europeans | 0.0 /100 | #291 | Tragic 1.6% |
| Italians | 0.0 /100 | #292 | Tragic 1.6% |
| Lithuanians | 0.0 /100 | #293 | Tragic 1.6% |
| Swedes | 0.0 /100 | #294 | Tragic 1.6% |
| Finns | 0.0 /100 | #295 | Tragic 1.6% |
| Poles | 0.0 /100 | #296 | Tragic 1.6% |
| Immigrants | Nonimmigrants | 0.0 /100 | #297 | Tragic 1.6% |
| Cajuns | 0.0 /100 | #298 | Tragic 1.6% |
| Portuguese | 0.0 /100 | #299 | Tragic 1.6% |
| Shoshone | 0.0 /100 | #300 | Tragic 1.6% |
Demographics Similar to Afghans by Disability Age Under 5
In terms of disability age under 5, the demographic groups most similar to Afghans are Immigrants from Grenada (0.94%, a difference of 0.020%), Soviet Union (0.95%, a difference of 0.19%), Yuman (0.95%, a difference of 0.27%), Immigrants from Hong Kong (0.95%, a difference of 0.30%), and Marshallese (0.94%, a difference of 0.76%).
| Demographics | Rating | Rank | Disability Age Under 5 |
| Immigrants | Uzbekistan | 100.0 /100 | #4 | Exceptional 0.85% |
| Immigrants | Bangladesh | 100.0 /100 | #5 | Exceptional 0.85% |
| Ute | 100.0 /100 | #6 | Exceptional 0.86% |
| Immigrants | Afghanistan | 100.0 /100 | #7 | Exceptional 0.91% |
| Immigrants | Yemen | 100.0 /100 | #8 | Exceptional 0.91% |
| Immigrants | Fiji | 100.0 /100 | #9 | Exceptional 0.92% |
| Marshallese | 100.0 /100 | #10 | Exceptional 0.94% |
| Afghans | 100.0 /100 | #11 | Exceptional 0.94% |
| Immigrants | Grenada | 100.0 /100 | #12 | Exceptional 0.94% |
| Soviet Union | 100.0 /100 | #13 | Exceptional 0.95% |
| Yuman | 100.0 /100 | #14 | Exceptional 0.95% |
| Immigrants | Hong Kong | 100.0 /100 | #15 | Exceptional 0.95% |
| Immigrants | Israel | 100.0 /100 | #16 | Exceptional 0.96% |
| Immigrants | China | 100.0 /100 | #17 | Exceptional 0.96% |
| Immigrants | Barbados | 100.0 /100 | #18 | Exceptional 0.97% |