Lithuanian vs Immigrants from Western Asia Disability Age Under 5
COMPARE
Lithuanian
Immigrants from Western Asia
Disability Age Under 5
Disability Age Under 5 Comparison
Lithuanians
Immigrants from Western Asia
1.6%
DISABILITY AGE UNDER 5
0.0/ 100
METRIC RATING
293rd/ 347
METRIC RANK
1.1%
DISABILITY AGE UNDER 5
99.2/ 100
METRIC RATING
60th/ 347
METRIC RANK
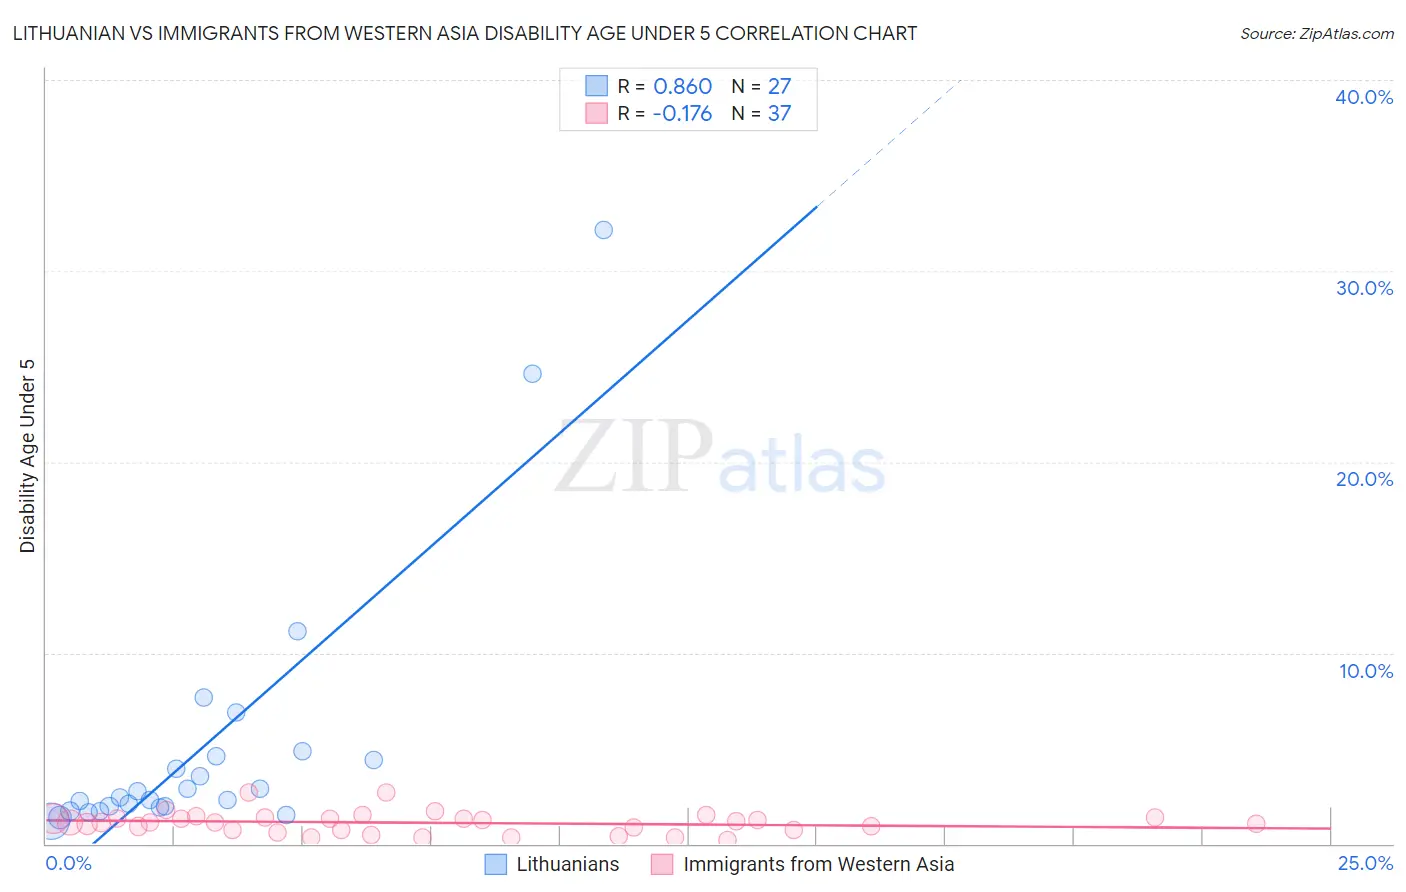
Lithuanian vs Immigrants from Western Asia Disability Age Under 5 Correlation Chart
The statistical analysis conducted on geographies consisting of 215,672,117 people shows a very strong positive correlation between the proportion of Lithuanians and percentage of population with a disability under the age of 5 in the United States with a correlation coefficient (R) of 0.860 and weighted average of 1.6%. Similarly, the statistical analysis conducted on geographies consisting of 218,056,003 people shows a poor negative correlation between the proportion of Immigrants from Western Asia and percentage of population with a disability under the age of 5 in the United States with a correlation coefficient (R) of -0.176 and weighted average of 1.1%, a difference of 41.2%.
Disability Age Under 5 Correlation Summary
| Measurement | Lithuanian | Immigrants from Western Asia |
| Minimum | 1.2% | 0.20% |
| Maximum | 32.1% | 2.7% |
| Range | 31.0% | 2.5% |
| Mean | 5.1% | 1.1% |
| Median | 2.4% | 1.1% |
| Interquartile 25% (IQ1) | 1.9% | 0.72% |
| Interquartile 75% (IQ3) | 4.6% | 1.4% |
| Interquartile Range (IQR) | 2.7% | 0.63% |
| Standard Deviation (Sample) | 7.1% | 0.57% |
| Standard Deviation (Population) | 7.0% | 0.57% |
Similar Demographics by Disability Age Under 5
Demographics Similar to Lithuanians by Disability Age Under 5
In terms of disability age under 5, the demographic groups most similar to Lithuanians are Italian (1.6%, a difference of 0.46%), Northern European (1.6%, a difference of 0.61%), Czech (1.5%, a difference of 0.70%), Hungarian (1.5%, a difference of 0.83%), and Estonian (1.5%, a difference of 0.97%).
| Demographics | Rating | Rank | Disability Age Under 5 |
| Tlingit-Haida | 0.0 /100 | #286 | Tragic 1.5% |
| Scandinavians | 0.0 /100 | #287 | Tragic 1.5% |
| Estonians | 0.0 /100 | #288 | Tragic 1.5% |
| Hungarians | 0.0 /100 | #289 | Tragic 1.5% |
| Czechs | 0.0 /100 | #290 | Tragic 1.5% |
| Northern Europeans | 0.0 /100 | #291 | Tragic 1.6% |
| Italians | 0.0 /100 | #292 | Tragic 1.6% |
| Lithuanians | 0.0 /100 | #293 | Tragic 1.6% |
| Swedes | 0.0 /100 | #294 | Tragic 1.6% |
| Finns | 0.0 /100 | #295 | Tragic 1.6% |
| Poles | 0.0 /100 | #296 | Tragic 1.6% |
| Immigrants | Nonimmigrants | 0.0 /100 | #297 | Tragic 1.6% |
| Cajuns | 0.0 /100 | #298 | Tragic 1.6% |
| Portuguese | 0.0 /100 | #299 | Tragic 1.6% |
| Shoshone | 0.0 /100 | #300 | Tragic 1.6% |
Demographics Similar to Immigrants from Western Asia by Disability Age Under 5
In terms of disability age under 5, the demographic groups most similar to Immigrants from Western Asia are Immigrants from Ethiopia (1.1%, a difference of 0.060%), Immigrants from Switzerland (1.1%, a difference of 0.070%), Immigrants from Vietnam (1.1%, a difference of 0.18%), Egyptian (1.1%, a difference of 0.64%), and Immigrants from Malaysia (1.1%, a difference of 0.76%).
| Demographics | Rating | Rank | Disability Age Under 5 |
| Asians | 99.6 /100 | #53 | Exceptional 1.1% |
| Immigrants | El Salvador | 99.6 /100 | #54 | Exceptional 1.1% |
| Salvadorans | 99.5 /100 | #55 | Exceptional 1.1% |
| Ecuadorians | 99.5 /100 | #56 | Exceptional 1.1% |
| Assyrians/Chaldeans/Syriacs | 99.5 /100 | #57 | Exceptional 1.1% |
| Immigrants | Egypt | 99.4 /100 | #58 | Exceptional 1.1% |
| Immigrants | Malaysia | 99.4 /100 | #59 | Exceptional 1.1% |
| Immigrants | Western Asia | 99.2 /100 | #60 | Exceptional 1.1% |
| Immigrants | Ethiopia | 99.2 /100 | #61 | Exceptional 1.1% |
| Immigrants | Switzerland | 99.2 /100 | #62 | Exceptional 1.1% |
| Immigrants | Vietnam | 99.1 /100 | #63 | Exceptional 1.1% |
| Egyptians | 98.9 /100 | #64 | Exceptional 1.1% |
| Immigrants | Korea | 98.8 /100 | #65 | Exceptional 1.1% |
| Immigrants | Indonesia | 98.7 /100 | #66 | Exceptional 1.1% |
| Immigrants | Belize | 98.7 /100 | #67 | Exceptional 1.1% |