Immigrants from Costa Rica vs Scotch-Irish Disability Age Under 5
COMPARE
Immigrants from Costa Rica
Scotch-Irish
Disability Age Under 5
Disability Age Under 5 Comparison
Immigrants from Costa Rica
Scotch-Irish
1.3%
DISABILITY AGE UNDER 5
5.5/ 100
METRIC RATING
229th/ 347
METRIC RANK
1.7%
DISABILITY AGE UNDER 5
0.0/ 100
METRIC RATING
320th/ 347
METRIC RANK
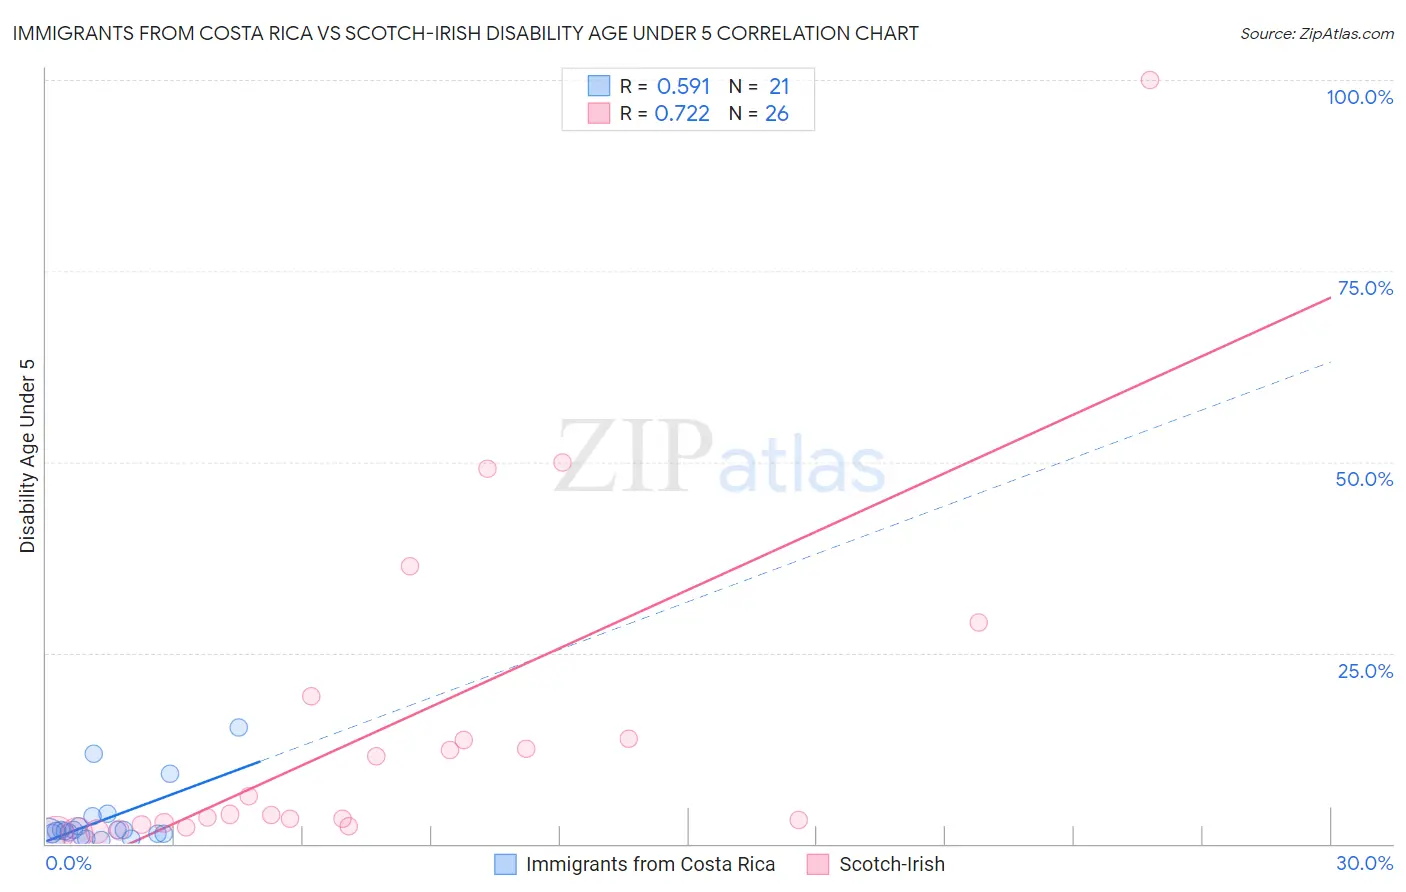
Immigrants from Costa Rica vs Scotch-Irish Disability Age Under 5 Correlation Chart
The statistical analysis conducted on geographies consisting of 133,028,674 people shows a substantial positive correlation between the proportion of Immigrants from Costa Rica and percentage of population with a disability under the age of 5 in the United States with a correlation coefficient (R) of 0.591 and weighted average of 1.3%. Similarly, the statistical analysis conducted on geographies consisting of 253,637,747 people shows a strong positive correlation between the proportion of Scotch-Irish and percentage of population with a disability under the age of 5 in the United States with a correlation coefficient (R) of 0.722 and weighted average of 1.7%, a difference of 29.6%.
Disability Age Under 5 Correlation Summary
| Measurement | Immigrants from Costa Rica | Scotch-Irish |
| Minimum | 0.49% | 1.3% |
| Maximum | 15.2% | 100.0% |
| Range | 14.7% | 98.7% |
| Mean | 3.1% | 15.0% |
| Median | 1.7% | 3.8% |
| Interquartile 25% (IQ1) | 1.2% | 2.5% |
| Interquartile 75% (IQ3) | 2.9% | 13.7% |
| Interquartile Range (IQR) | 1.7% | 11.1% |
| Standard Deviation (Sample) | 3.9% | 22.4% |
| Standard Deviation (Population) | 3.8% | 22.0% |
Similar Demographics by Disability Age Under 5
Demographics Similar to Immigrants from Costa Rica by Disability Age Under 5
In terms of disability age under 5, the demographic groups most similar to Immigrants from Costa Rica are Lebanese (1.3%, a difference of 0.10%), Luxembourger (1.3%, a difference of 0.21%), Taiwanese (1.3%, a difference of 0.23%), Immigrants from Northern Europe (1.3%, a difference of 0.34%), and French American Indian (1.3%, a difference of 0.47%).
| Demographics | Rating | Rank | Disability Age Under 5 |
| Ukrainians | 8.3 /100 | #222 | Tragic 1.3% |
| Hispanics or Latinos | 7.7 /100 | #223 | Tragic 1.3% |
| Latvians | 7.1 /100 | #224 | Tragic 1.3% |
| Panamanians | 7.1 /100 | #225 | Tragic 1.3% |
| Bahamians | 7.1 /100 | #226 | Tragic 1.3% |
| Taiwanese | 6.1 /100 | #227 | Tragic 1.3% |
| Luxembourgers | 6.1 /100 | #228 | Tragic 1.3% |
| Immigrants | Costa Rica | 5.5 /100 | #229 | Tragic 1.3% |
| Lebanese | 5.3 /100 | #230 | Tragic 1.3% |
| Immigrants | Northern Europe | 4.7 /100 | #231 | Tragic 1.3% |
| French American Indians | 4.5 /100 | #232 | Tragic 1.3% |
| Tongans | 4.2 /100 | #233 | Tragic 1.3% |
| Pueblo | 3.8 /100 | #234 | Tragic 1.3% |
| Central American Indians | 3.6 /100 | #235 | Tragic 1.3% |
| South American Indians | 3.3 /100 | #236 | Tragic 1.3% |
Demographics Similar to Scotch-Irish by Disability Age Under 5
In terms of disability age under 5, the demographic groups most similar to Scotch-Irish are Ottawa (1.7%, a difference of 0.060%), Slovak (1.7%, a difference of 0.53%), German (1.7%, a difference of 0.63%), Irish (1.7%, a difference of 0.84%), and French (1.7%, a difference of 1.1%).
| Demographics | Rating | Rank | Disability Age Under 5 |
| Celtics | 0.0 /100 | #313 | Tragic 1.7% |
| Norwegians | 0.0 /100 | #314 | Tragic 1.7% |
| Dutch | 0.0 /100 | #315 | Tragic 1.7% |
| Immigrants | Cabo Verde | 0.0 /100 | #316 | Tragic 1.7% |
| French | 0.0 /100 | #317 | Tragic 1.7% |
| Irish | 0.0 /100 | #318 | Tragic 1.7% |
| Slovaks | 0.0 /100 | #319 | Tragic 1.7% |
| Scotch-Irish | 0.0 /100 | #320 | Tragic 1.7% |
| Ottawa | 0.0 /100 | #321 | Tragic 1.7% |
| Germans | 0.0 /100 | #322 | Tragic 1.7% |
| Chickasaw | 0.0 /100 | #323 | Tragic 1.7% |
| Cherokee | 0.0 /100 | #324 | Tragic 1.8% |
| Immigrants | Portugal | 0.0 /100 | #325 | Tragic 1.8% |
| Sioux | 0.0 /100 | #326 | Tragic 1.8% |
| Osage | 0.0 /100 | #327 | Tragic 1.8% |