Lithuanian vs Mongolian Self-Care Disability
COMPARE
Lithuanian
Mongolian
Self-Care Disability
Self-Care Disability Comparison
Lithuanians
Mongolians
2.4%
SELF-CARE DISABILITY
98.0/ 100
METRIC RATING
88th/ 347
METRIC RANK
2.3%
SELF-CARE DISABILITY
99.3/ 100
METRIC RATING
63rd/ 347
METRIC RANK
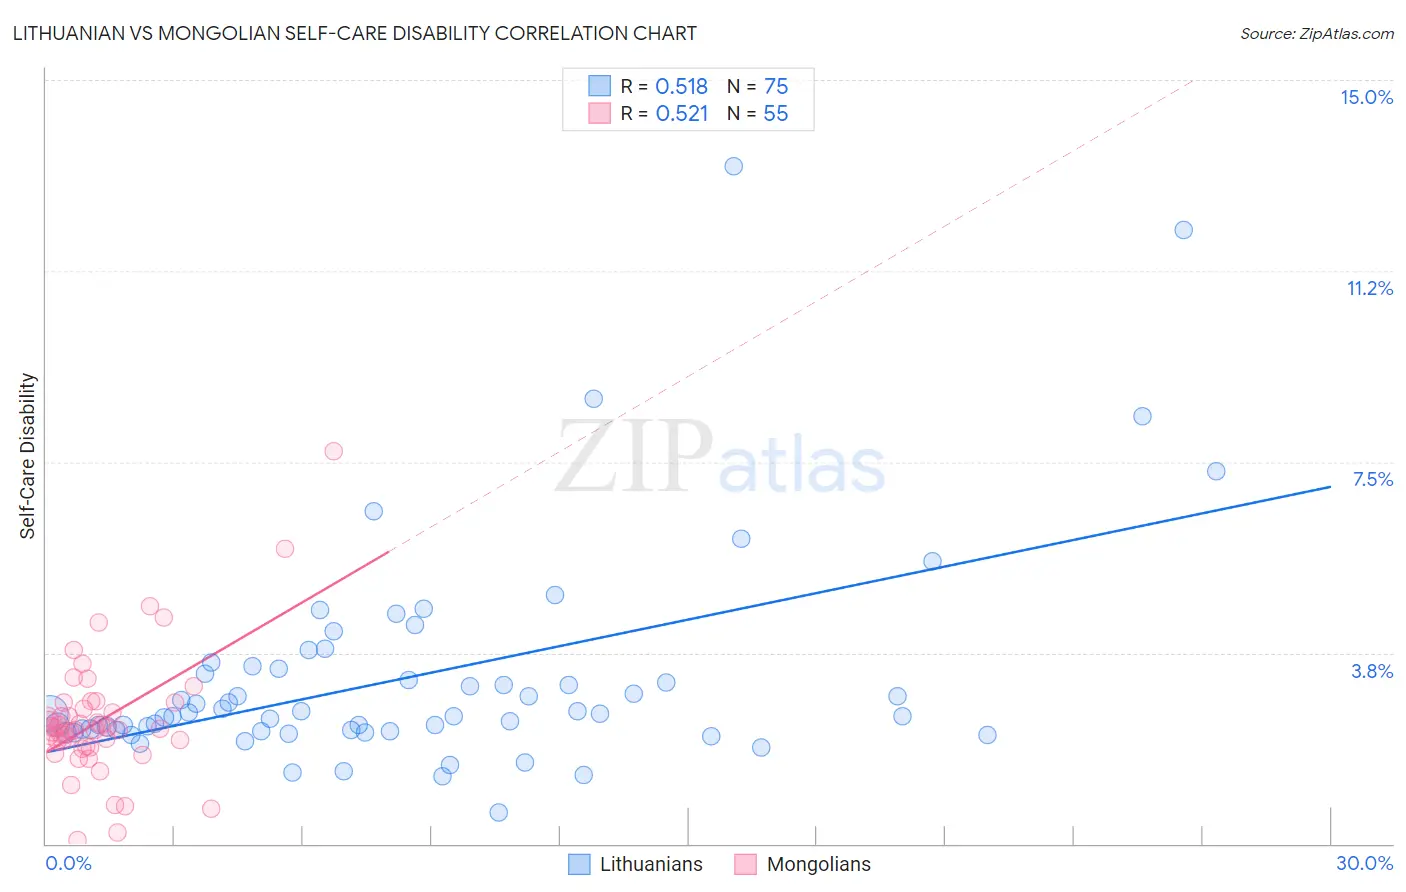
Lithuanian vs Mongolian Self-Care Disability Correlation Chart
The statistical analysis conducted on geographies consisting of 421,348,071 people shows a substantial positive correlation between the proportion of Lithuanians and percentage of population with self-care disability in the United States with a correlation coefficient (R) of 0.518 and weighted average of 2.4%. Similarly, the statistical analysis conducted on geographies consisting of 140,258,079 people shows a substantial positive correlation between the proportion of Mongolians and percentage of population with self-care disability in the United States with a correlation coefficient (R) of 0.521 and weighted average of 2.3%, a difference of 1.4%.
Self-Care Disability Correlation Summary
| Measurement | Lithuanian | Mongolian |
| Minimum | 0.63% | 0.065% |
| Maximum | 13.3% | 7.7% |
| Range | 12.7% | 7.6% |
| Mean | 3.3% | 2.4% |
| Median | 2.6% | 2.2% |
| Interquartile 25% (IQ1) | 2.2% | 1.9% |
| Interquartile 75% (IQ3) | 3.4% | 2.8% |
| Interquartile Range (IQR) | 1.2% | 0.86% |
| Standard Deviation (Sample) | 2.2% | 1.2% |
| Standard Deviation (Population) | 2.1% | 1.2% |
Similar Demographics by Self-Care Disability
Demographics Similar to Lithuanians by Self-Care Disability
In terms of self-care disability, the demographic groups most similar to Lithuanians are Sierra Leonean (2.4%, a difference of 0.0%), Immigrants from Congo (2.4%, a difference of 0.050%), Immigrants from Northern Africa (2.3%, a difference of 0.14%), Estonian (2.3%, a difference of 0.16%), and Immigrants from Czechoslovakia (2.4%, a difference of 0.19%).
| Demographics | Rating | Rank | Self-Care Disability |
| Ugandans | 98.8 /100 | #81 | Exceptional 2.3% |
| Immigrants | Denmark | 98.8 /100 | #82 | Exceptional 2.3% |
| Indians (Asian) | 98.7 /100 | #83 | Exceptional 2.3% |
| Immigrants | Spain | 98.7 /100 | #84 | Exceptional 2.3% |
| Estonians | 98.3 /100 | #85 | Exceptional 2.3% |
| Immigrants | Northern Africa | 98.2 /100 | #86 | Exceptional 2.3% |
| Sierra Leoneans | 98.0 /100 | #87 | Exceptional 2.4% |
| Lithuanians | 98.0 /100 | #88 | Exceptional 2.4% |
| Immigrants | Congo | 98.0 /100 | #89 | Exceptional 2.4% |
| Immigrants | Czechoslovakia | 97.7 /100 | #90 | Exceptional 2.4% |
| Immigrants | Jordan | 97.7 /100 | #91 | Exceptional 2.4% |
| Icelanders | 97.4 /100 | #92 | Exceptional 2.4% |
| Immigrants | Latvia | 97.0 /100 | #93 | Exceptional 2.4% |
| Macedonians | 96.9 /100 | #94 | Exceptional 2.4% |
| Immigrants | Asia | 96.9 /100 | #95 | Exceptional 2.4% |
Demographics Similar to Mongolians by Self-Care Disability
In terms of self-care disability, the demographic groups most similar to Mongolians are Swedish (2.3%, a difference of 0.010%), Brazilian (2.3%, a difference of 0.070%), Egyptian (2.3%, a difference of 0.090%), Immigrants from Argentina (2.3%, a difference of 0.10%), and South African (2.3%, a difference of 0.13%).
| Demographics | Rating | Rank | Self-Care Disability |
| Immigrants | Eastern Asia | 99.6 /100 | #56 | Exceptional 2.3% |
| Immigrants | Belgium | 99.6 /100 | #57 | Exceptional 2.3% |
| Immigrants | Cameroon | 99.6 /100 | #58 | Exceptional 2.3% |
| New Zealanders | 99.5 /100 | #59 | Exceptional 2.3% |
| Immigrants | Japan | 99.5 /100 | #60 | Exceptional 2.3% |
| Palestinians | 99.4 /100 | #61 | Exceptional 2.3% |
| Egyptians | 99.4 /100 | #62 | Exceptional 2.3% |
| Mongolians | 99.3 /100 | #63 | Exceptional 2.3% |
| Swedes | 99.3 /100 | #64 | Exceptional 2.3% |
| Brazilians | 99.3 /100 | #65 | Exceptional 2.3% |
| Immigrants | Argentina | 99.3 /100 | #66 | Exceptional 2.3% |
| South Africans | 99.3 /100 | #67 | Exceptional 2.3% |
| Immigrants | Zaire | 99.2 /100 | #68 | Exceptional 2.3% |
| Immigrants | Norway | 99.2 /100 | #69 | Exceptional 2.3% |
| Immigrants | Northern Europe | 99.2 /100 | #70 | Exceptional 2.3% |