Lithuanian vs Ukrainian Self-Care Disability
COMPARE
Lithuanian
Ukrainian
Self-Care Disability
Self-Care Disability Comparison
Lithuanians
Ukrainians
2.4%
SELF-CARE DISABILITY
98.0/ 100
METRIC RATING
88th/ 347
METRIC RANK
2.5%
SELF-CARE DISABILITY
21.4/ 100
METRIC RATING
193rd/ 347
METRIC RANK
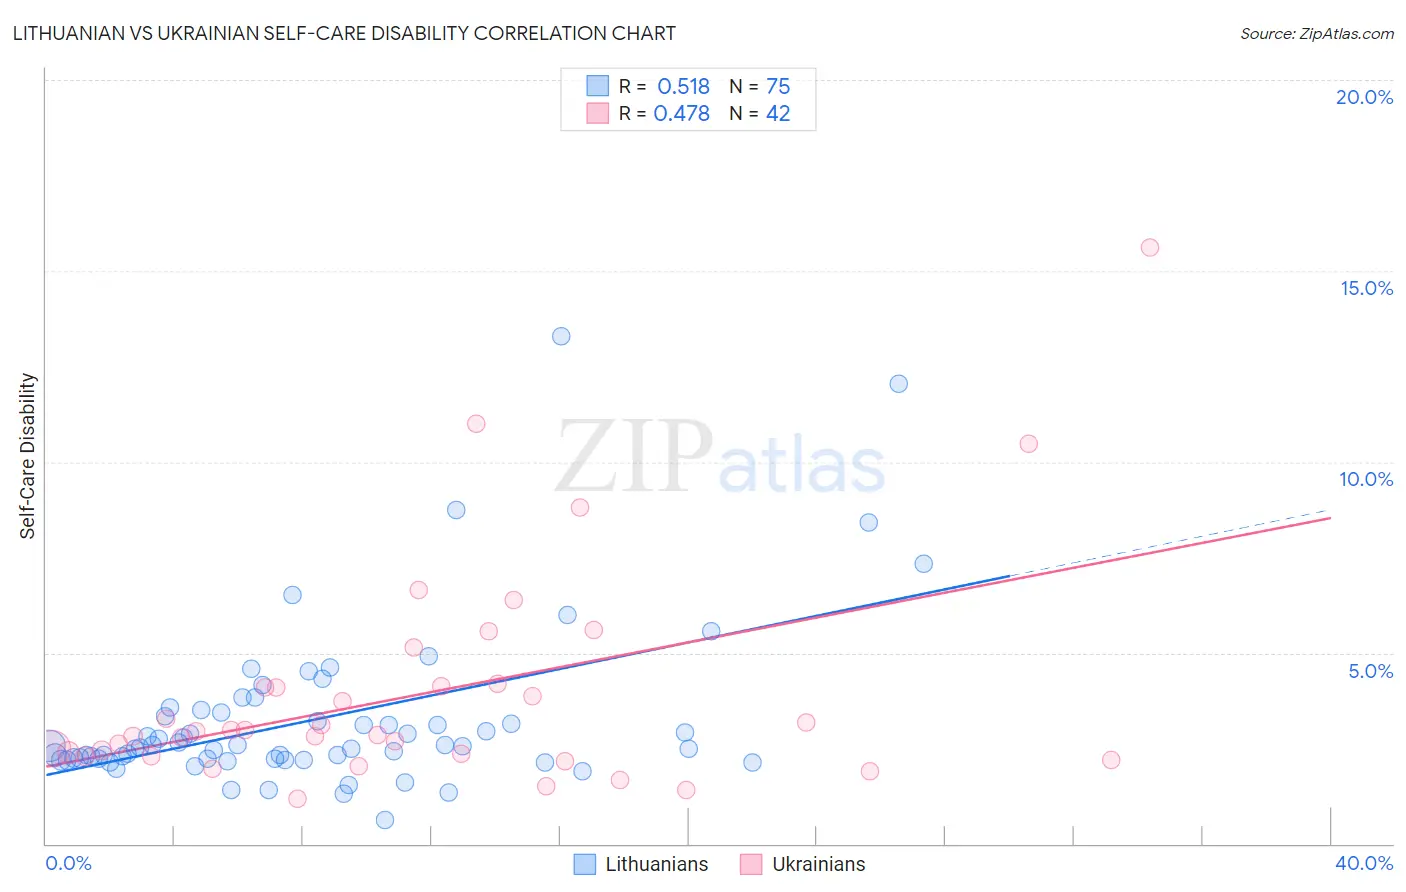
Lithuanian vs Ukrainian Self-Care Disability Correlation Chart
The statistical analysis conducted on geographies consisting of 421,348,071 people shows a substantial positive correlation between the proportion of Lithuanians and percentage of population with self-care disability in the United States with a correlation coefficient (R) of 0.518 and weighted average of 2.4%. Similarly, the statistical analysis conducted on geographies consisting of 447,906,196 people shows a moderate positive correlation between the proportion of Ukrainians and percentage of population with self-care disability in the United States with a correlation coefficient (R) of 0.478 and weighted average of 2.5%, a difference of 6.5%.
Self-Care Disability Correlation Summary
| Measurement | Lithuanian | Ukrainian |
| Minimum | 0.63% | 1.2% |
| Maximum | 13.3% | 15.6% |
| Range | 12.7% | 14.4% |
| Mean | 3.3% | 3.9% |
| Median | 2.6% | 2.9% |
| Interquartile 25% (IQ1) | 2.2% | 2.3% |
| Interquartile 75% (IQ3) | 3.4% | 4.1% |
| Interquartile Range (IQR) | 1.2% | 1.8% |
| Standard Deviation (Sample) | 2.2% | 2.9% |
| Standard Deviation (Population) | 2.1% | 2.9% |
Similar Demographics by Self-Care Disability
Demographics Similar to Lithuanians by Self-Care Disability
In terms of self-care disability, the demographic groups most similar to Lithuanians are Sierra Leonean (2.4%, a difference of 0.0%), Immigrants from Congo (2.4%, a difference of 0.050%), Immigrants from Northern Africa (2.3%, a difference of 0.14%), Estonian (2.3%, a difference of 0.16%), and Immigrants from Czechoslovakia (2.4%, a difference of 0.19%).
| Demographics | Rating | Rank | Self-Care Disability |
| Ugandans | 98.8 /100 | #81 | Exceptional 2.3% |
| Immigrants | Denmark | 98.8 /100 | #82 | Exceptional 2.3% |
| Indians (Asian) | 98.7 /100 | #83 | Exceptional 2.3% |
| Immigrants | Spain | 98.7 /100 | #84 | Exceptional 2.3% |
| Estonians | 98.3 /100 | #85 | Exceptional 2.3% |
| Immigrants | Northern Africa | 98.2 /100 | #86 | Exceptional 2.3% |
| Sierra Leoneans | 98.0 /100 | #87 | Exceptional 2.4% |
| Lithuanians | 98.0 /100 | #88 | Exceptional 2.4% |
| Immigrants | Congo | 98.0 /100 | #89 | Exceptional 2.4% |
| Immigrants | Czechoslovakia | 97.7 /100 | #90 | Exceptional 2.4% |
| Immigrants | Jordan | 97.7 /100 | #91 | Exceptional 2.4% |
| Icelanders | 97.4 /100 | #92 | Exceptional 2.4% |
| Immigrants | Latvia | 97.0 /100 | #93 | Exceptional 2.4% |
| Macedonians | 96.9 /100 | #94 | Exceptional 2.4% |
| Immigrants | Asia | 96.9 /100 | #95 | Exceptional 2.4% |
Demographics Similar to Ukrainians by Self-Care Disability
In terms of self-care disability, the demographic groups most similar to Ukrainians are Soviet Union (2.5%, a difference of 0.060%), Moroccan (2.5%, a difference of 0.11%), Sioux (2.5%, a difference of 0.22%), Immigrants from Germany (2.5%, a difference of 0.26%), and Immigrants from Eastern Europe (2.5%, a difference of 0.42%).
| Demographics | Rating | Rank | Self-Care Disability |
| Immigrants | El Salvador | 33.0 /100 | #186 | Fair 2.5% |
| Irish | 28.7 /100 | #187 | Fair 2.5% |
| Immigrants | Oceania | 28.3 /100 | #188 | Fair 2.5% |
| Immigrants | Eastern Europe | 28.0 /100 | #189 | Fair 2.5% |
| Sioux | 24.6 /100 | #190 | Fair 2.5% |
| Moroccans | 22.9 /100 | #191 | Fair 2.5% |
| Soviet Union | 22.2 /100 | #192 | Fair 2.5% |
| Ukrainians | 21.4 /100 | #193 | Fair 2.5% |
| Immigrants | Germany | 17.9 /100 | #194 | Poor 2.5% |
| Immigrants | Southern Europe | 15.6 /100 | #195 | Poor 2.5% |
| Koreans | 15.5 /100 | #196 | Poor 2.5% |
| Crow | 15.2 /100 | #197 | Poor 2.5% |
| Immigrants | Immigrants | 15.0 /100 | #198 | Poor 2.5% |
| Immigrants | Ghana | 14.7 /100 | #199 | Poor 2.5% |
| Immigrants | Western Africa | 13.3 /100 | #200 | Poor 2.5% |