Lithuanian vs Mongolian Median Household Income
COMPARE
Lithuanian
Mongolian
Median Household Income
Median Household Income Comparison
Lithuanians
Mongolians
$93,852
MEDIAN HOUSEHOLD INCOME
99.6/ 100
METRIC RATING
72nd/ 347
METRIC RANK
$93,971
MEDIAN HOUSEHOLD INCOME
99.7/ 100
METRIC RATING
68th/ 347
METRIC RANK
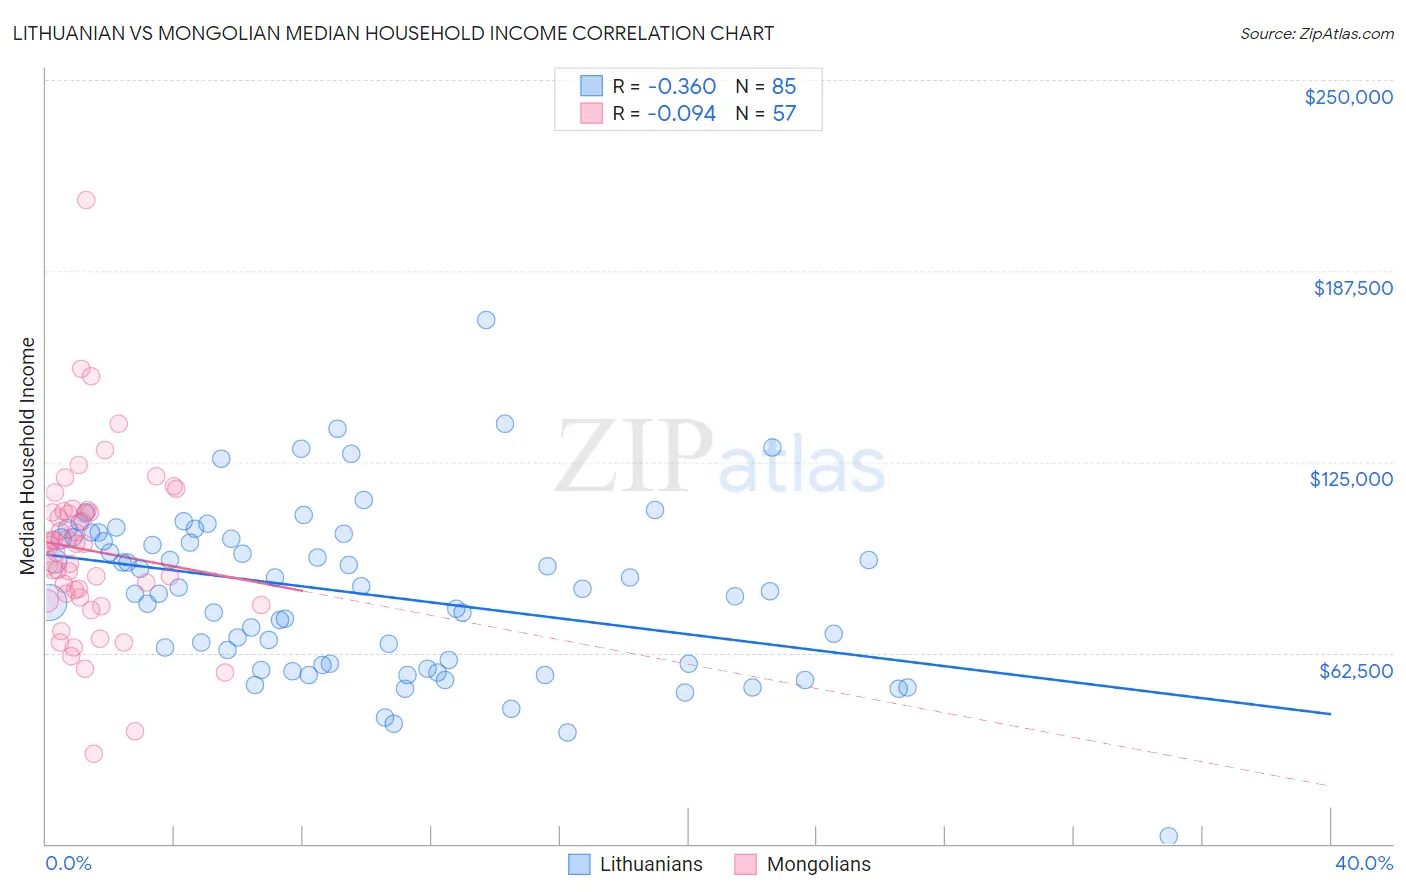
Lithuanian vs Mongolian Median Household Income Correlation Chart
The statistical analysis conducted on geographies consisting of 421,640,790 people shows a mild negative correlation between the proportion of Lithuanians and median household income in the United States with a correlation coefficient (R) of -0.360 and weighted average of $93,852. Similarly, the statistical analysis conducted on geographies consisting of 140,276,403 people shows a slight negative correlation between the proportion of Mongolians and median household income in the United States with a correlation coefficient (R) of -0.094 and weighted average of $93,971, a difference of 0.13%.
Median Household Income Correlation Summary
| Measurement | Lithuanian | Mongolian |
| Minimum | $2,499 | $29,643 |
| Maximum | $171,528 | $210,785 |
| Range | $169,029 | $181,142 |
| Mean | $81,905 | $96,039 |
| Median | $82,500 | $97,648 |
| Interquartile 25% (IQ1) | $58,701 | $79,996 |
| Interquartile 75% (IQ3) | $100,159 | $108,680 |
| Interquartile Range (IQR) | $41,458 | $28,684 |
| Standard Deviation (Sample) | $27,290 | $28,830 |
| Standard Deviation (Population) | $27,129 | $28,576 |
Demographics Similar to Lithuanians and Mongolians by Median Household Income
In terms of median household income, the demographic groups most similar to Lithuanians are Immigrants from Philippines ($93,899, a difference of 0.050%), Immigrants from Fiji ($93,933, a difference of 0.090%), Argentinean ($93,960, a difference of 0.11%), Immigrants from Egypt ($93,700, a difference of 0.16%), and Immigrants from Scotland ($94,091, a difference of 0.25%). Similarly, the demographic groups most similar to Mongolians are Argentinean ($93,960, a difference of 0.010%), Immigrants from Fiji ($93,933, a difference of 0.040%), Immigrants from Philippines ($93,899, a difference of 0.080%), Immigrants from Scotland ($94,091, a difference of 0.13%), and Immigrants from Romania ($94,222, a difference of 0.27%).
| Demographics | Rating | Rank | Median Household Income |
| Koreans | 99.8 /100 | #60 | Exceptional $95,018 |
| Laotians | 99.8 /100 | #61 | Exceptional $94,990 |
| Immigrants | Norway | 99.8 /100 | #62 | Exceptional $94,846 |
| Greeks | 99.8 /100 | #63 | Exceptional $94,735 |
| Immigrants | Netherlands | 99.7 /100 | #64 | Exceptional $94,411 |
| Immigrants | Belarus | 99.7 /100 | #65 | Exceptional $94,399 |
| Immigrants | Romania | 99.7 /100 | #66 | Exceptional $94,222 |
| Immigrants | Scotland | 99.7 /100 | #67 | Exceptional $94,091 |
| Mongolians | 99.7 /100 | #68 | Exceptional $93,971 |
| Argentineans | 99.7 /100 | #69 | Exceptional $93,960 |
| Immigrants | Fiji | 99.7 /100 | #70 | Exceptional $93,933 |
| Immigrants | Philippines | 99.6 /100 | #71 | Exceptional $93,899 |
| Lithuanians | 99.6 /100 | #72 | Exceptional $93,852 |
| Immigrants | Egypt | 99.6 /100 | #73 | Exceptional $93,700 |
| Immigrants | Latvia | 99.6 /100 | #74 | Exceptional $93,602 |
| Immigrants | Italy | 99.5 /100 | #75 | Exceptional $93,465 |
| South Africans | 99.5 /100 | #76 | Exceptional $93,379 |
| Immigrants | Afghanistan | 99.5 /100 | #77 | Exceptional $93,375 |
| Immigrants | Bulgaria | 99.4 /100 | #78 | Exceptional $93,148 |
| Sri Lankans | 99.4 /100 | #79 | Exceptional $93,093 |
| Tongans | 99.4 /100 | #80 | Exceptional $93,076 |